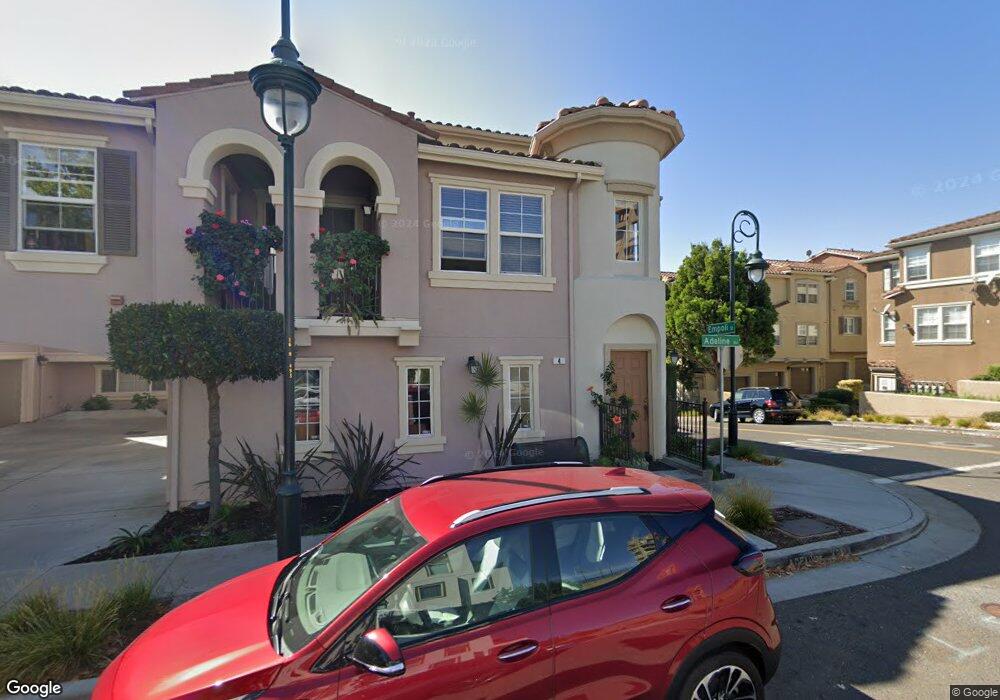
388 Adeline Ave Unit 2 San Jose, CA 95136
South San Jose NeighborhoodEstimated Value: $883,755 - $1,007,000
2
Beds
3
Baths
1,264
Sq Ft
$727/Sq Ft
Est. Value
About This Home
This home is located at 388 Adeline Ave Unit 2, San Jose, CA 95136 and is currently estimated at $919,189, approximately $727 per square foot. 388 Adeline Ave Unit 2 is a home located in Santa Clara County with nearby schools including George Shirakawa Sr. Elementary School, Sylvandale Middle School, and Andrew P. Hill High School.
Ownership History
Date
Name
Owned For
Owner Type
Purchase Details
Closed on
May 18, 2020
Sold by
Bony Michall
Bought by
Bony Michall and The Michall Bony Trust
Current Estimated Value
Purchase Details
Closed on
Apr 14, 2006
Sold by
Roth Christian
Bought by
Bony Michall
Home Financials for this Owner
Home Financials are based on the most recent Mortgage that was taken out on this home.
Original Mortgage
$58,410
Interest Rate
6.25%
Mortgage Type
Unknown
Purchase Details
Closed on
Nov 7, 2003
Sold by
Kb Home South Bay Inc
Bought by
Roth Christian
Home Financials for this Owner
Home Financials are based on the most recent Mortgage that was taken out on this home.
Original Mortgage
$380,250
Interest Rate
5.5%
Mortgage Type
Purchase Money Mortgage
Create a Home Valuation Report for This Property
The Home Valuation Report is an in-depth analysis detailing your home's value as well as a comparison with similar homes in the area
Home Values in the Area
Average Home Value in this Area
Purchase History
| Date | Buyer | Sale Price | Title Company |
|---|---|---|---|
| Bony Michall | -- | None Available | |
| Bony Michall | $584,500 | First American Title Company | |
| Roth Christian | $475,500 | First American Title Company |
Source: Public Records
Mortgage History
| Date | Status | Borrower | Loan Amount |
|---|---|---|---|
| Closed | Bony Michall | $58,410 | |
| Open | Bony Michall | $467,280 | |
| Previous Owner | Roth Christian | $380,250 | |
| Closed | Roth Christian | $71,250 |
Source: Public Records
Tax History Compared to Growth
Tax History
| Year | Tax Paid | Tax Assessment Tax Assessment Total Assessment is a certain percentage of the fair market value that is determined by local assessors to be the total taxable value of land and additions on the property. | Land | Improvement |
|---|---|---|---|---|
| 2025 | $12,037 | $798,204 | $399,032 | $399,172 |
| 2024 | $12,037 | $782,554 | $391,208 | $391,346 |
| 2023 | $11,839 | $767,211 | $383,538 | $383,673 |
| 2022 | $11,489 | $752,168 | $376,018 | $376,150 |
| 2021 | $11,433 | $737,421 | $368,646 | $368,775 |
| 2020 | $10,966 | $729,860 | $364,866 | $364,994 |
| 2019 | $10,492 | $715,550 | $357,712 | $357,838 |
| 2018 | $10,490 | $701,521 | $350,699 | $350,822 |
| 2017 | $9,763 | $643,000 | $321,400 | $321,600 |
| 2016 | $8,963 | $602,000 | $300,900 | $301,100 |
| 2015 | $8,362 | $555,000 | $277,500 | $277,500 |
| 2014 | $6,806 | $465,000 | $232,500 | $232,500 |
Source: Public Records
Map
Nearby Homes
- 338 Llano de Los Robles Ave Unit 3
- 501 Casselino Dr Unit 324
- 546 Marble Arch Ave
- 586 Marble Arch Ave
- 465 Tower Hill Ave
- 539 Elk Ridge Way
- 349 Marble Arch Ave Unit 78
- 3053 Elk Ridge Ct
- 202 Agustin Narvaez St Unit 2
- 223 William Manly St Unit 1
- 199 William Manly St Unit 3
- 432 Curraghmore Ct
- 193 William Manly St Unit 4
- 337 Ballymore Cir
- 3077 Valley of Hearts Del Place Unit 6
- 3048 Mary Helen Ln
- 111 Llano de Los Robles Ave Unit 2
- 3489 Quarry Park Dr
- 2957 Valley of Hearts Delight Place
- 255 Mountain Springs Dr
- 388 Adeline Ave Unit 3
- 388 Adeline Ave Unit 1
- 388 Adeline Ave Unit 4
- 3108 Empoli St
- 376 Adeline Ave Unit 218
- 374 Adeline Ave
- 384 Adeline Ave
- 3116 Empoli St Unit 215
- 372 Adeline Ave
- 378 Adeline Ave Unit 209
- 3122 Empoli St
- 379 Casselino Dr
- 377 Casselino Dr Unit 222
- 370 Adeline Ave Unit 221
- 375 Casselino Dr
- 424 Adeline Ave
- 426 Adeline Ave Unit 273
- 402 Adeline Ave
- 389 Casselino Dr Unit 4
- 389 Casselino Dr Unit 1