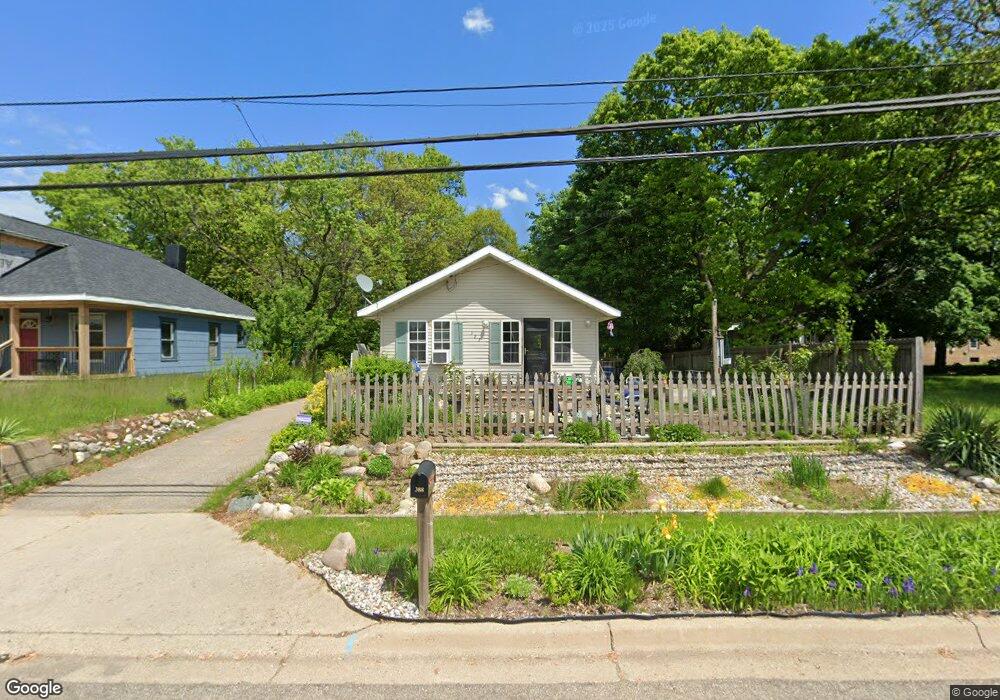
388 Hubbard St Battle Creek, MI 49037
North Central NeighborhoodEstimated Value: $87,000 - $95,000
2
Beds
1
Bath
880
Sq Ft
$102/Sq Ft
Est. Value
About This Home
This home is located at 388 Hubbard St, Battle Creek, MI 49037 and is currently estimated at $90,090, approximately $102 per square foot. 388 Hubbard St is a home located in Calhoun County with nearby schools including Dudley School, Northwestern Middle School, and Battle Creek Central High School.
Ownership History
Date
Name
Owned For
Owner Type
Purchase Details
Closed on
Oct 13, 2014
Sold by
Bernheisel Mercedes
Bought by
Bernheisel Stephanie
Current Estimated Value
Purchase Details
Closed on
Jul 2, 2009
Sold by
Richardson Roderick L and Richardson Evelyn L
Bought by
Deutsche Bank National Trust Company
Purchase Details
Closed on
Feb 23, 2007
Sold by
Richardson Roderick
Bought by
Richardson Roderick and Richardson Evelyn
Home Financials for this Owner
Home Financials are based on the most recent Mortgage that was taken out on this home.
Original Mortgage
$69,350
Interest Rate
11.59%
Mortgage Type
New Conventional
Purchase Details
Closed on
Apr 26, 2006
Sold by
Healey Timothy
Bought by
Richardson Roderick
Home Financials for this Owner
Home Financials are based on the most recent Mortgage that was taken out on this home.
Original Mortgage
$61,514
Interest Rate
6.42%
Mortgage Type
FHA
Purchase Details
Closed on
Aug 1, 2005
Sold by
Healey Timothy D and Peavey Patrick
Bought by
Healey Timothy D
Purchase Details
Closed on
May 2, 2005
Sold by
Allen Opal T
Bought by
Healey Timothy D and Peavey Patrick L
Create a Home Valuation Report for This Property
The Home Valuation Report is an in-depth analysis detailing your home's value as well as a comparison with similar homes in the area
Home Values in the Area
Average Home Value in this Area
Purchase History
| Date | Buyer | Sale Price | Title Company |
|---|---|---|---|
| Bernheisel Stephanie | -- | None Available | |
| Deutsche Bank National Trust Company | $15,300 | None Available | |
| Richardson Roderick | -- | Capitol City Title Agency | |
| Richardson Roderick | $62,000 | Chicago Title | |
| Healey Timothy D | -- | Multiple | |
| Healey Timothy D | $23,000 | Metropolitan Title Company |
Source: Public Records
Mortgage History
| Date | Status | Borrower | Loan Amount |
|---|---|---|---|
| Previous Owner | Richardson Roderick | $69,350 | |
| Previous Owner | Richardson Roderick | $61,514 |
Source: Public Records
Tax History Compared to Growth
Tax History
| Year | Tax Paid | Tax Assessment Tax Assessment Total Assessment is a certain percentage of the fair market value that is determined by local assessors to be the total taxable value of land and additions on the property. | Land | Improvement |
|---|---|---|---|---|
| 2025 | -- | $31,300 | $0 | $0 |
| 2024 | $771 | $26,035 | $0 | $0 |
| 2023 | $695 | $22,345 | $0 | $0 |
| 2022 | $549 | $18,831 | $0 | $0 |
| 2021 | $656 | $16,504 | $0 | $0 |
| 2020 | $730 | $14,862 | $0 | $0 |
| 2019 | $727 | $13,587 | $0 | $0 |
| 2018 | $727 | $17,404 | $556 | $16,848 |
| 2017 | $705 | $16,410 | $0 | $0 |
| 2016 | $704 | $17,211 | $0 | $0 |
| 2015 | $689 | $15,984 | $2,784 | $13,200 |
| 2014 | $689 | $14,960 | $2,784 | $12,176 |
Source: Public Records
Map
Nearby Homes
- 188 Roseneath Ave
- 435 Kendall St N
- 5 Beglin Ct
- 224 Hubbard St
- 52 Roseneath Ave
- 129 Fox Ave
- 216 Kendall St N
- 253 Greenwood Ave
- 89 Somerset Ave
- 69 Jordan St
- 60 Graves Ave
- 125 Oaklawn Ave
- 161 Wilds Ave
- 562 Van Buren St W
- 35 Hubbard St
- 0 W Vanburen 027 St Unit 22040287
- 0 W Vanburen 025 St Unit 22040286
- 0 W Vanburen 032 St Unit 22040288
- 46 Walter Ave
- 0 W Michigan 011 Ave Unit 22040285
- 392 Hubbard St
- 208 Roosevelt Ave W
- 204 Roosevelt Ave W
- 23 May St
- 202 Roosevelt Ave W
- 192 Roosevelt Ave W
- 408 Hubbard St
- 188 Roosevelt Ave W
- 201 Roosevelt Ave W
- 412 Hubbard St
- 184 Roosevelt Ave W
- 197 Roosevelt Ave W
- 197 W Roosevelt Ave
- 24 May St
- 176 Roosevelt Ave W
- 354 Hubbard St
- 361 Wood St N
- 348 Hubbard St
- 401 Wood St N
- 436 Hubbard St