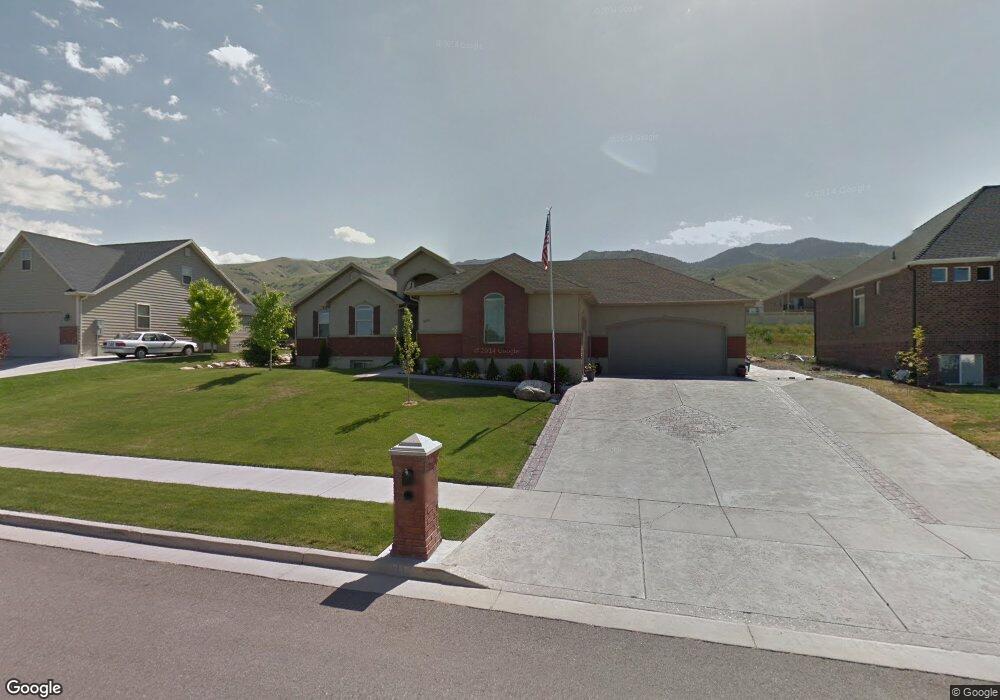
388 S 980 E Unit 5 Smithfield, UT 84335
Estimated Value: $632,000 - $741,000
Studio
--
Bath
1,804
Sq Ft
$378/Sq Ft
Est. Value
About This Home
This home is located at 388 S 980 E Unit 5, Smithfield, UT 84335 and is currently estimated at $681,723, approximately $377 per square foot. 388 S 980 E Unit 5 is a home located in Cache County with nearby schools including Sunrise School, Cedar Ridge School, and North Cache Middle School.
Ownership History
Date
Name
Owned For
Owner Type
Purchase Details
Closed on
Jul 6, 2023
Sold by
Amundsen John R and Amundsen Bobbie Jonell
Bought by
Brown Abraham
Current Estimated Value
Home Financials for this Owner
Home Financials are based on the most recent Mortgage that was taken out on this home.
Original Mortgage
$641,250
Outstanding Balance
$622,745
Interest Rate
6.79%
Mortgage Type
New Conventional
Estimated Equity
$58,978
Purchase Details
Closed on
Jun 28, 2023
Sold by
Brown Abraham
Bought by
Brown Abraham and Brown Melissa L
Home Financials for this Owner
Home Financials are based on the most recent Mortgage that was taken out on this home.
Original Mortgage
$641,250
Outstanding Balance
$622,745
Interest Rate
6.79%
Mortgage Type
New Conventional
Estimated Equity
$58,978
Purchase Details
Closed on
Jul 10, 2007
Sold by
Poulsen Construction Inc
Bought by
Amundsen John R and Amundsen Bobbie J
Home Financials for this Owner
Home Financials are based on the most recent Mortgage that was taken out on this home.
Original Mortgage
$225,000
Interest Rate
6.41%
Mortgage Type
New Conventional
Purchase Details
Closed on
Feb 15, 2006
Sold by
Johns Daniel E and Johns Holly H
Bought by
Poulsen Construction Inc
Home Financials for this Owner
Home Financials are based on the most recent Mortgage that was taken out on this home.
Original Mortgage
$234,000
Interest Rate
6.15%
Mortgage Type
Construction
Create a Home Valuation Report for This Property
The Home Valuation Report is an in-depth analysis detailing your home's value as well as a comparison with similar homes in the area
Home Values in the Area
Average Home Value in this Area
Purchase History
| Date | Buyer | Sale Price | Title Company |
|---|---|---|---|
| Brown Abraham | -- | Stewart Title | |
| Brown Abraham | -- | Us Title | |
| Amundsen John R | -- | Cache Title Company | |
| Poulsen Construction Inc | -- | Pinnacle Title Ins Agency |
Source: Public Records
Mortgage History
| Date | Status | Borrower | Loan Amount |
|---|---|---|---|
| Open | Brown Abraham | $641,250 | |
| Previous Owner | Amundsen John R | $225,000 | |
| Previous Owner | Poulsen Construction Inc | $234,000 |
Source: Public Records
Tax History
| Year | Tax Paid | Tax Assessment Tax Assessment Total Assessment is a certain percentage of the fair market value that is determined by local assessors to be the total taxable value of land and additions on the property. | Land | Improvement |
|---|---|---|---|---|
| 2025 | $274 | $367,055 | $0 | $0 |
| 2024 | $3,135 | $393,725 | $0 | $0 |
| 2023 | $3,288 | $390,500 | $0 | $0 |
| 2022 | $334 | $390,500 | $0 | $0 |
| 2021 | $2,605 | $465,028 | $80,000 | $385,028 |
| 2020 | $2,491 | $414,807 | $80,000 | $334,807 |
| 2019 | $2,480 | $393,757 | $58,950 | $334,807 |
| 2018 | $2,331 | $357,885 | $58,950 | $298,935 |
| 2017 | $2,254 | $189,010 | $0 | $0 |
| 2016 | $2,293 | $160,645 | $0 | $0 |
| 2015 | $1,957 | $160,645 | $0 | $0 |
| 2014 | $1,919 | $160,645 | $0 | $0 |
| 2013 | -- | $160,645 | $0 | $0 |
Source: Public Records
Map
Nearby Homes
- 434 S Cardon Ridge Dr
- 1092 E 300 S
- 127 S 830 E Unit 304
- 413 S 1150 E Unit 1101
- 12 S 1150 E Unit 8
- 577 S 1140 E Unit 1202
- 641 S 1080 E Unit 44
- 670 S 1080 E Unit 37
- 628 S 1080 E
- 111 S 1250 E
- 722 S 1040 E Unit 21
- 738 S 1150 E Unit 9
- 2 S 1200 E Unit 15
- 776 S 1150 E
- 13 N 1150 E
- 442 S 455 E
- 396 S 455 E
- 139 Fairway Dr
- 125 Fairway Dr
- 818 Summit Dr
Your Personal Tour Guide
Ask me questions while you tour the home.