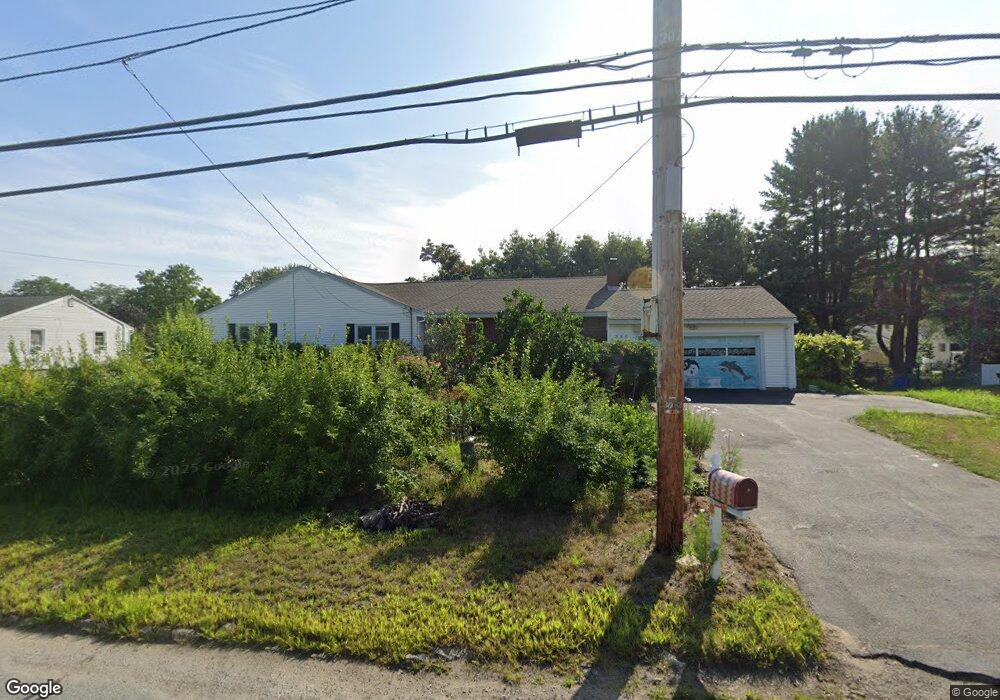
388 S Main St Andover, MA 01810
Estimated Value: $755,000 - $908,000
3
Beds
2
Baths
2,200
Sq Ft
$376/Sq Ft
Est. Value
About This Home
This home is located at 388 S Main St, Andover, MA 01810 and is currently estimated at $827,309, approximately $376 per square foot. 388 S Main St is a home located in Essex County with nearby schools including South Elementary School, Doherty Middle School, and Andover High School.
Ownership History
Date
Name
Owned For
Owner Type
Purchase Details
Closed on
Jul 27, 2007
Sold by
Fnma
Bought by
Cheng Hongsheng and Yu Huan
Current Estimated Value
Purchase Details
Closed on
Dec 20, 2006
Sold by
Moore Robert J and Washington Mutual Bk
Bought by
Federal National Mortgage Association
Purchase Details
Closed on
May 31, 2002
Sold by
Grecoe Julianna and Esposito Joseph A
Bought by
Moore Robert J
Purchase Details
Closed on
Jan 5, 1988
Sold by
Hanson Rt
Bought by
Esposito Joseph A
Create a Home Valuation Report for This Property
The Home Valuation Report is an in-depth analysis detailing your home's value as well as a comparison with similar homes in the area
Home Values in the Area
Average Home Value in this Area
Purchase History
| Date | Buyer | Sale Price | Title Company |
|---|---|---|---|
| Cheng Hongsheng | $367,000 | -- | |
| Cheng Hongsheng | $367,000 | -- | |
| Cheng Hongsheng | $367,000 | -- | |
| Federal National Mortgage Association | -- | -- | |
| Federal National Mortgage Association | -- | -- | |
| Moore Robert J | $379,500 | -- | |
| Moore Robert J | $379,500 | -- | |
| Esposito Joseph A | $207,500 | -- |
Source: Public Records
Mortgage History
| Date | Status | Borrower | Loan Amount |
|---|---|---|---|
| Open | Esposito Joseph A | $217,500 | |
| Closed | Esposito Joseph A | $225,000 |
Source: Public Records
Tax History Compared to Growth
Tax History
| Year | Tax Paid | Tax Assessment Tax Assessment Total Assessment is a certain percentage of the fair market value that is determined by local assessors to be the total taxable value of land and additions on the property. | Land | Improvement |
|---|---|---|---|---|
| 2024 | $8,357 | $648,800 | $367,000 | $281,800 |
| 2023 | $8,118 | $594,300 | $339,700 | $254,600 |
| 2022 | $7,420 | $508,200 | $287,800 | $220,400 |
| 2021 | $7,101 | $464,400 | $261,600 | $202,800 |
| 2020 | $6,810 | $453,700 | $255,200 | $198,500 |
| 2019 | $6,739 | $441,300 | $247,800 | $193,500 |
| 2018 | $6,445 | $412,100 | $233,700 | $178,400 |
| 2017 | $6,163 | $406,000 | $229,100 | $176,900 |
| 2016 | $6,017 | $406,000 | $229,100 | $176,900 |
| 2015 | $5,798 | $387,300 | $220,200 | $167,100 |
Source: Public Records
Map
Nearby Homes