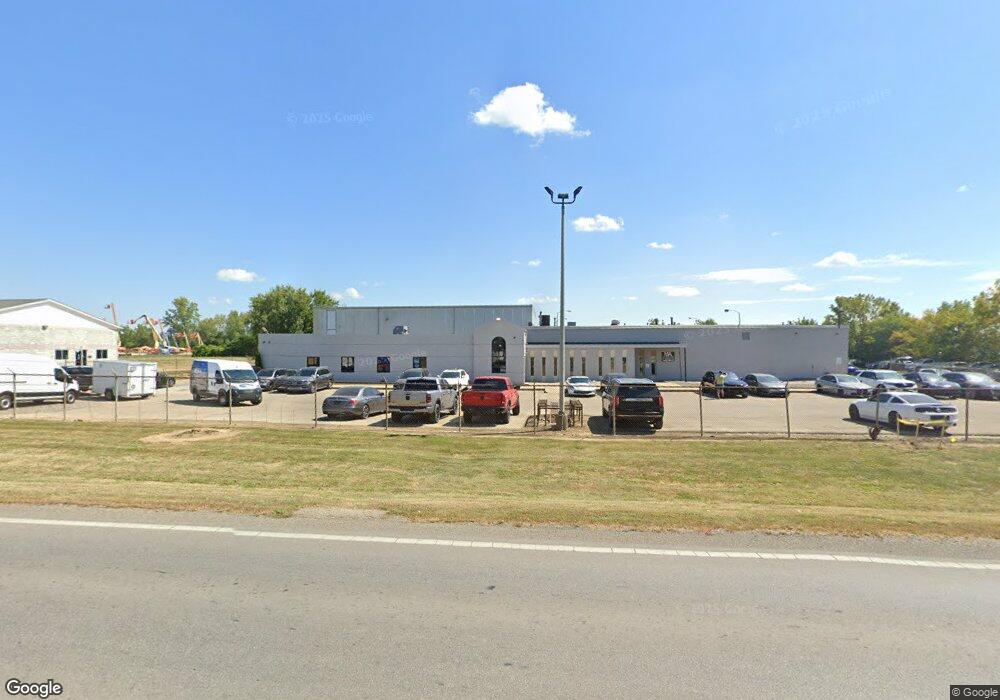
3880 Lockbourne Rd Columbus, OH 43207
Obetz-Lockbourne NeighborhoodEstimated Value: $755,199
--
Bed
--
Bath
16,301
Sq Ft
$46/Sq Ft
Est. Value
About This Home
This home is located at 3880 Lockbourne Rd, Columbus, OH 43207 and is currently estimated at $755,199, approximately $46 per square foot. 3880 Lockbourne Rd is a home located in Franklin County with nearby schools including Hamilton Intermediate School, Hamilton Elementary School, and Hamilton Middle School.
Ownership History
Date
Name
Owned For
Owner Type
Purchase Details
Closed on
Apr 27, 2015
Sold by
Opal Investment Inc
Bought by
3880 Gray Gables Realty Llc
Current Estimated Value
Purchase Details
Closed on
Jun 25, 2012
Sold by
Greer William J
Bought by
Opal Investment Inc
Purchase Details
Closed on
Oct 29, 1999
Sold by
Greer William J
Bought by
Hodge Ronnie
Purchase Details
Closed on
Nov 21, 1997
Sold by
Ohio Steak & Barbecue Co
Bought by
Greer William J
Home Financials for this Owner
Home Financials are based on the most recent Mortgage that was taken out on this home.
Original Mortgage
$370,000
Interest Rate
7.38%
Mortgage Type
Commercial
Purchase Details
Closed on
Jun 29, 1994
Sold by
Sara Lee Corp
Bought by
Ohio Steak & Barbecue Co
Purchase Details
Closed on
Sep 1, 1983
Create a Home Valuation Report for This Property
The Home Valuation Report is an in-depth analysis detailing your home's value as well as a comparison with similar homes in the area
Home Values in the Area
Average Home Value in this Area
Purchase History
| Date | Buyer | Sale Price | Title Company |
|---|---|---|---|
| 3880 Gray Gables Realty Llc | $325,000 | Hummel Title | |
| Opal Investment Inc | $450,000 | None Available | |
| Hodge Ronnie | $90,000 | Chicago Title | |
| Greer William J | $331,200 | -- | |
| Ohio Steak & Barbecue Co | $210,000 | -- | |
| -- | $209,800 | -- |
Source: Public Records
Mortgage History
| Date | Status | Borrower | Loan Amount |
|---|---|---|---|
| Previous Owner | Greer William J | $370,000 |
Source: Public Records
Tax History Compared to Growth
Tax History
| Year | Tax Paid | Tax Assessment Tax Assessment Total Assessment is a certain percentage of the fair market value that is determined by local assessors to be the total taxable value of land and additions on the property. | Land | Improvement |
|---|---|---|---|---|
| 2024 | $8,281 | $171,150 | $58,170 | $112,980 |
| 2023 | $8,162 | $171,150 | $58,170 | $112,980 |
| 2022 | $6,877 | $139,440 | $52,360 | $87,080 |
| 2021 | $7,035 | $139,440 | $52,360 | $87,080 |
| 2020 | $7,174 | $139,440 | $52,360 | $87,080 |
| 2019 | $6,470 | $116,210 | $43,650 | $72,560 |
| 2018 | $6,907 | $116,210 | $43,650 | $72,560 |
| 2017 | $6,855 | $116,210 | $43,650 | $72,560 |
| 2016 | $7,185 | $122,510 | $43,650 | $78,860 |
| 2015 | $7,426 | $122,510 | $43,650 | $78,860 |
| 2014 | $7,470 | $122,510 | $43,650 | $78,860 |
| 2013 | $3,709 | $122,500 | $43,645 | $78,855 |
Source: Public Records
Map
Nearby Homes
- 1068 Tobi Dr
- 1118 Maplewood Rd
- 989 Lavender Ln
- 1091 Vernon Dr
- 965 Radbourne Dr
- 1101 Meadow Ln
- 4451 1/2 Lockbourne Rd Unit R
- 864 Robmeyer Dr
- 1187 Rendezvous Ln
- 1085 Williams Rd
- 3629 S Champion Ave
- 1456 Magoffin Ave
- 1097 Rendezvous Ln
- 3573 S Champion Ave
- 904 Kyle Ave
- 4207 Crosspointe Dr
- 0 Williams Rd
- 3785 S Ohio Ave
- 3991 Graves Dr
- 1566 Chillicothe St
- 3993 Lockbourne Rd
- 1110 Gary Dr
- 1112 Lavender Ln
- 2561 Lockbourne Rd
- 2561 Lockbourne Rd
- 2476 Lockbourne Rd
- 1104 Gary Dr
- 1101 Esther Dr
- 1098 Gary Dr
- 1106 Lavender Ln
- 1095 Esther Dr
- 1092 Gary Dr
- 1100 Lavender Ln
- 4000 Cailin Dr
- 1300 S Columbus Airport Rd
- 1089 Esther Dr
- 1086 Esther Dr
- 4006 Cailin Dr
- 1094 Lavender Ln
- 1086 Gary Dr