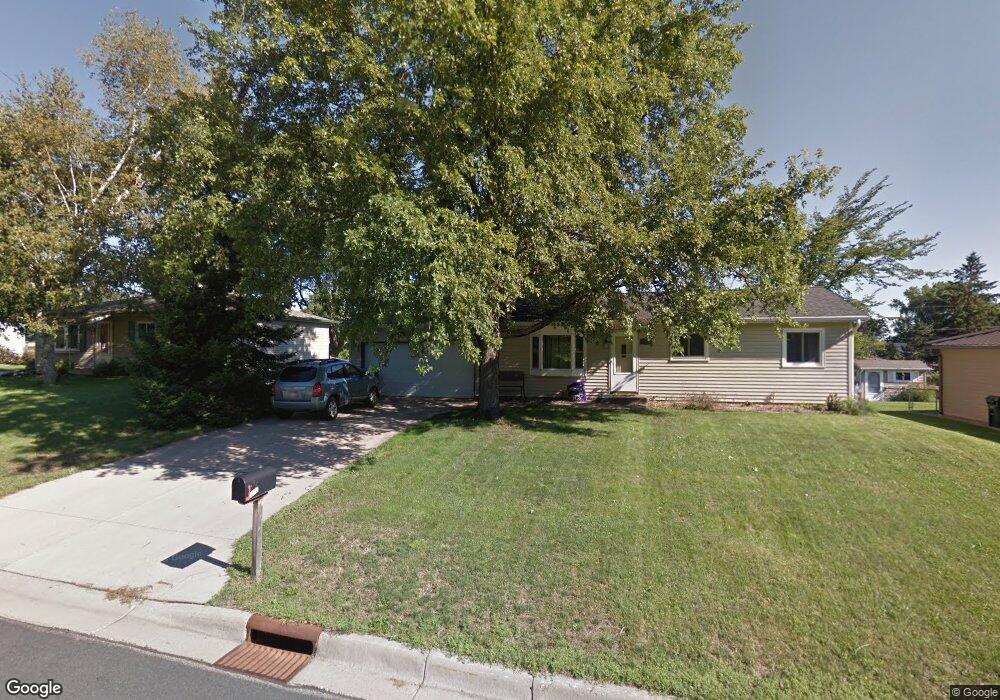
3881 78th St E Inver Grove Heights, MN 55076
Estimated Value: $318,000 - $335,000
3
Beds
1
Bath
1,056
Sq Ft
$308/Sq Ft
Est. Value
About This Home
This home is located at 3881 78th St E, Inver Grove Heights, MN 55076 and is currently estimated at $325,765, approximately $308 per square foot. 3881 78th St E is a home located in Dakota County with nearby schools including Hilltop Elementary School, Inver Grove Heights Middle School, and Simley Senior High School.
Ownership History
Date
Name
Owned For
Owner Type
Purchase Details
Closed on
Dec 22, 2011
Sold by
Martin Andrew S and Selvog Disa J
Bought by
Hamer Scott T
Current Estimated Value
Home Financials for this Owner
Home Financials are based on the most recent Mortgage that was taken out on this home.
Original Mortgage
$127,300
Outstanding Balance
$86,747
Interest Rate
3.93%
Mortgage Type
New Conventional
Estimated Equity
$239,018
Purchase Details
Closed on
Jun 25, 2007
Sold by
Hsbc Bank Usa
Bought by
Martin Andrew S and Selvog Disa J
Purchase Details
Closed on
Nov 30, 2005
Sold by
Johnson David L and Johnson John P
Bought by
Johnson Jeane M
Purchase Details
Closed on
Aug 30, 2001
Sold by
Myran John R and Myran Keri A
Bought by
Johnson David L and Johnson John P
Create a Home Valuation Report for This Property
The Home Valuation Report is an in-depth analysis detailing your home's value as well as a comparison with similar homes in the area
Home Values in the Area
Average Home Value in this Area
Purchase History
| Date | Buyer | Sale Price | Title Company |
|---|---|---|---|
| Hamer Scott T | $134,000 | Title Recording Services | |
| Martin Andrew S | $205,000 | -- | |
| Johnson Jeane M | $233,000 | -- | |
| Johnson David L | $174,000 | -- |
Source: Public Records
Mortgage History
| Date | Status | Borrower | Loan Amount |
|---|---|---|---|
| Open | Hamer Scott T | $127,300 |
Source: Public Records
Tax History Compared to Growth
Tax History
| Year | Tax Paid | Tax Assessment Tax Assessment Total Assessment is a certain percentage of the fair market value that is determined by local assessors to be the total taxable value of land and additions on the property. | Land | Improvement |
|---|---|---|---|---|
| 2024 | $2,822 | $291,800 | $74,400 | $217,400 |
| 2023 | $2,822 | $283,500 | $72,500 | $211,000 |
| 2022 | $2,486 | $280,400 | $72,400 | $208,000 |
| 2021 | $2,470 | $237,100 | $64,300 | $172,800 |
| 2020 | $2,424 | $232,100 | $61,300 | $170,800 |
| 2019 | $2,389 | $227,600 | $58,400 | $169,200 |
| 2018 | $2,135 | $211,100 | $55,600 | $155,500 |
| 2017 | $1,966 | $190,300 | $52,900 | $137,400 |
| 2016 | $1,939 | $174,200 | $50,400 | $123,800 |
| 2015 | $1,905 | $150,676 | $43,000 | $107,676 |
| 2014 | -- | $140,103 | $40,817 | $99,286 |
| 2013 | -- | $128,004 | $37,320 | $90,684 |
Source: Public Records
Map
Nearby Homes
- 3901 Conroy Trail
- 3907 Conroy Trail
- 3861 Conroy Trail
- 3617 76th Ln E
- 7996 Corey Path
- 3650 75th St E
- 7614 Connie Ln
- 4049 75th St E
- 7447 Cloman Way
- 8086 Dana Path
- 8104 Dana Path
- 7944 Charles Way
- 7344 Degrio Way
- 7393 Clayton Ave
- 8336 Cloman Ave
- 8381 Corcoran Cir Unit 49
- 8404 Copperfield Way Unit 101
- 8406 Copperfield Way Unit 102
- 7169 Clay Ave
- 8124 Clifford Cir