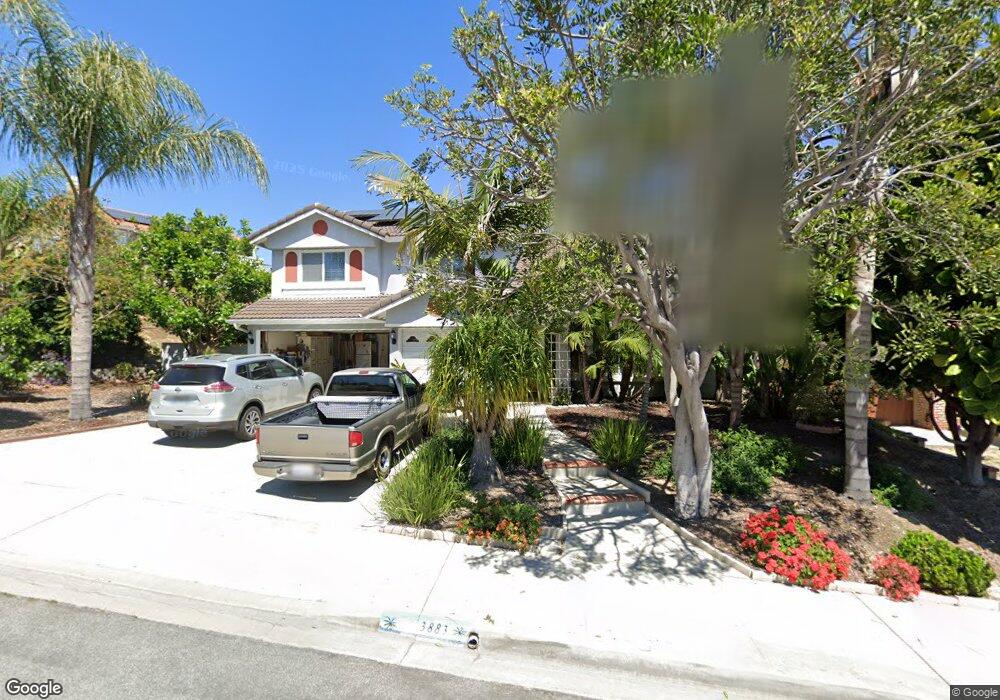
3883 Cornell Dr Oceanside, CA 92056
Mira Costa NeighborhoodEstimated Value: $1,101,515 - $1,236,000
5
Beds
3
Baths
2,718
Sq Ft
$424/Sq Ft
Est. Value
About This Home
This home is located at 3883 Cornell Dr, Oceanside, CA 92056 and is currently estimated at $1,151,629, approximately $423 per square foot. 3883 Cornell Dr is a home located in San Diego County with nearby schools including Christa McAuliffe Elementary School, Martin Luther King Jr. Middle School, and El Camino High School.
Ownership History
Date
Name
Owned For
Owner Type
Purchase Details
Closed on
Aug 5, 1999
Sold by
Brunner Ted and Brunner Trish
Bought by
Brunner Theodore P and Brunner Patricia M
Current Estimated Value
Purchase Details
Closed on
Jun 8, 1999
Sold by
Naccarato John R and Naccarato Mary A
Bought by
Brunner Ted and Brunner Trish
Purchase Details
Closed on
Dec 1, 1998
Sold by
Naccarato John R and Naccarato Mary A
Bought by
Naccarato John and Naccarato Mary Annette
Purchase Details
Closed on
Jun 29, 1990
Create a Home Valuation Report for This Property
The Home Valuation Report is an in-depth analysis detailing your home's value as well as a comparison with similar homes in the area
Home Values in the Area
Average Home Value in this Area
Purchase History
| Date | Buyer | Sale Price | Title Company |
|---|---|---|---|
| Brunner Theodore P | -- | Southland Title | |
| Brunner Ted | $280,000 | Southland Title | |
| Naccarato John | -- | -- | |
| -- | $274,000 | -- |
Source: Public Records
Tax History
| Year | Tax Paid | Tax Assessment Tax Assessment Total Assessment is a certain percentage of the fair market value that is determined by local assessors to be the total taxable value of land and additions on the property. | Land | Improvement |
|---|---|---|---|---|
| 2025 | $4,774 | $438,015 | $169,056 | $268,959 |
| 2024 | $4,774 | $429,428 | $165,742 | $263,686 |
| 2023 | $4,626 | $421,009 | $162,493 | $258,516 |
| 2022 | $4,555 | $412,755 | $159,307 | $253,448 |
| 2021 | $4,571 | $404,663 | $156,184 | $248,479 |
| 2020 | $4,429 | $400,515 | $154,583 | $245,932 |
| 2019 | $4,300 | $392,662 | $151,552 | $241,110 |
| 2018 | $4,253 | $384,964 | $148,581 | $236,383 |
| 2017 | $71 | $377,417 | $145,668 | $231,749 |
| 2016 | $4,037 | $370,017 | $142,812 | $227,205 |
| 2015 | $3,918 | $364,460 | $140,667 | $223,793 |
| 2014 | $3,766 | $357,322 | $137,912 | $219,410 |
Source: Public Records
Map
Nearby Homes
- 2858 Lehigh Ct
- 2868 Brandeis Dr
- 3929 Marvin St
- 3945 Shenandoah Dr
- 2801 College Blvd
- 400 Sea Cliff Way Unit 402
- 4062 Lewis St
- 4081 Thomas St
- 3258 San Helena Dr
- 3278 San Tomas Dr
- 4116 Chasin St
- 3531 Cameo Dr Unit 98
- 4145 Marcella St
- 2385 Rancho Del Oro Rd Unit 59
- 2395 Rancho Del Oro Rd Unit 30
- 2395 Rancho Del Oro Rd Unit 29
- 4123 Jonathon St
- 4129 Terry St
- 4128 Terry St
- 3376 Corsica Way
- 3879 Cornell Dr
- 3901 Stanford Dr
- 3905 Stanford Dr
- 3909 Stanford Dr
- 3913 Stanford Dr
- 3917 Stanford Dr
- 3884 Cornell Dr
- 3861 Stanford Dr
- 3875 Cornell Dr
- 3880 Cornell Dr
- 3871 Cornell Dr
- 3857 Stanford Dr
- 3867 Cornell Dr
- 3921 Stanford Dr
- 3922 Stanford Dr
- 3858 Cornell Dr
- 3910 Stanford Dr
- 3914 Stanford Dr
- 3906 Stanford Dr
- 3902 Stanford Dr
Your Personal Tour Guide
Ask me questions while you tour the home.