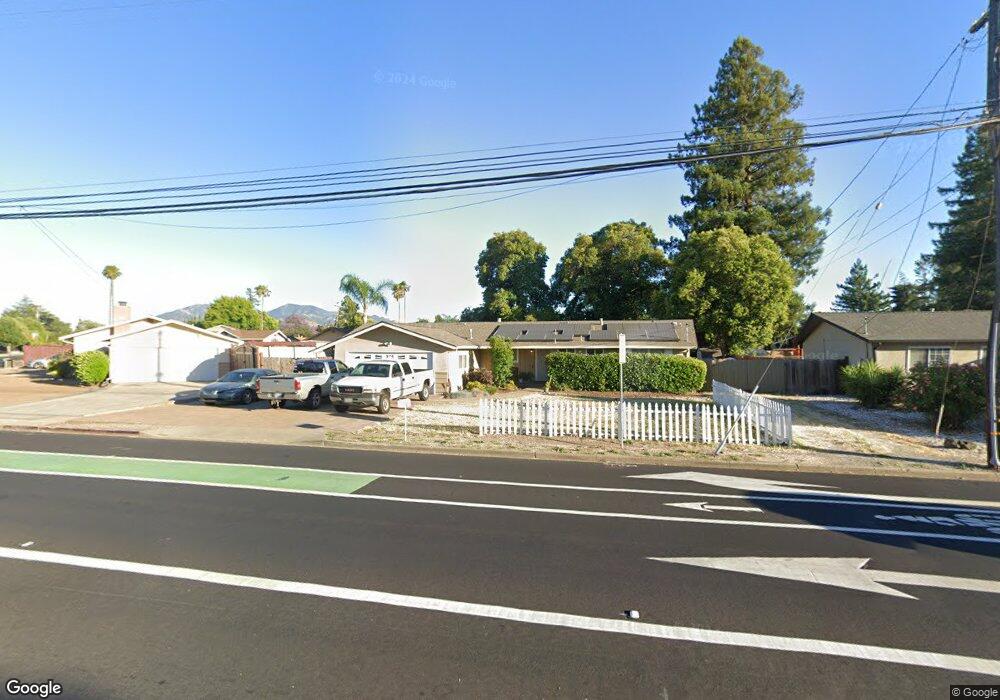
3884 Concord Blvd Concord, CA 94519
Parkside NeighborhoodEstimated Value: $686,000 - $836,000
4
Beds
3
Baths
1,783
Sq Ft
$440/Sq Ft
Est. Value
About This Home
This home is located at 3884 Concord Blvd, Concord, CA 94519 and is currently estimated at $783,958, approximately $439 per square foot. 3884 Concord Blvd is a home located in Contra Costa County with nearby schools including Wren Avenue Elementary School, El Dorado Middle School, and Concord High School.
Ownership History
Date
Name
Owned For
Owner Type
Purchase Details
Closed on
Mar 1, 2011
Sold by
E Trade Financial
Bought by
Kent Steven L and Kent Stephanie K
Current Estimated Value
Home Financials for this Owner
Home Financials are based on the most recent Mortgage that was taken out on this home.
Original Mortgage
$279,732
Outstanding Balance
$190,942
Interest Rate
4.96%
Mortgage Type
FHA
Estimated Equity
$593,016
Purchase Details
Closed on
Jul 26, 2010
Sold by
Shah Mohammad Amin and Shah Mohammad
Bought by
E Trade Financial
Purchase Details
Closed on
Oct 7, 2004
Sold by
Shah Jamina
Bought by
Shah Mohammad Amin
Home Financials for this Owner
Home Financials are based on the most recent Mortgage that was taken out on this home.
Original Mortgage
$404,000
Interest Rate
5.65%
Mortgage Type
Stand Alone First
Purchase Details
Closed on
Oct 6, 2004
Sold by
Mattingly V James R and Mattingly Tracy C
Bought by
Shah Mohammad Amin
Home Financials for this Owner
Home Financials are based on the most recent Mortgage that was taken out on this home.
Original Mortgage
$404,000
Interest Rate
5.65%
Mortgage Type
Stand Alone First
Purchase Details
Closed on
Dec 5, 2002
Sold by
Mattingly V James R and Mattingly Tracy C
Bought by
Mattingly V James R and Mattingly Tracy C
Home Financials for this Owner
Home Financials are based on the most recent Mortgage that was taken out on this home.
Original Mortgage
$202,000
Interest Rate
6.06%
Mortgage Type
Purchase Money Mortgage
Purchase Details
Closed on
Jun 21, 1999
Sold by
Rizzo Michael A and Rizzo Elizabeth G
Bought by
Mattingly V James R
Home Financials for this Owner
Home Financials are based on the most recent Mortgage that was taken out on this home.
Original Mortgage
$206,618
Interest Rate
7.2%
Mortgage Type
FHA
Purchase Details
Closed on
Dec 16, 1997
Sold by
Drasin and Hall Bethany H Tre
Bought by
Rizzo Michael A and Rizzo Elizabeth G
Home Financials for this Owner
Home Financials are based on the most recent Mortgage that was taken out on this home.
Original Mortgage
$150,350
Interest Rate
7.16%
Mortgage Type
Purchase Money Mortgage
Purchase Details
Closed on
Jul 3, 1996
Sold by
Drasin Edward and Drasin Rochelle
Bought by
Drasin Edward and Drasin Rochelle A
Create a Home Valuation Report for This Property
The Home Valuation Report is an in-depth analysis detailing your home's value as well as a comparison with similar homes in the area
Home Values in the Area
Average Home Value in this Area
Purchase History
We collect this data history from publicly available records. To have your information removed, we recommend requesting removal directly through your county’s website.
| Date | Buyer | Sale Price | Title Company |
|---|---|---|---|
| Kent Steven L | $283,500 | Fidelity National Title Co | |
| E Trade Financial | $316,350 | Landsafe Title | |
| Shah Mohammad Amin | -- | Placer Title | |
| Shah Mohammad Amin | $505,000 | Placer Title | |
| Mattingly V James R | -- | Alliance Title Company | |
| Mattingly V James R | $208,000 | Old Republic Title Company | |
| Rizzo Michael A | $155,000 | Placer Title Company | |
| Drasin Edward | -- | -- |
Source: Public Records
Mortgage History
We collect this data history from publicly available records. To have your information removed, we recommend requesting removal directly through your county’s website.
| Date | Status | Borrower | Loan Amount |
|---|---|---|---|
| Open | Kent Steven L | $279,732 | |
| Previous Owner | Shah Mohammad Amin | $404,000 | |
| Previous Owner | Mattingly V James R | $202,000 | |
| Previous Owner | Mattingly V James R | $206,618 | |
| Previous Owner | Rizzo Michael A | $150,350 | |
| Closed | Shah Mohammad Amin | $101,000 |
Source: Public Records
Tax History
| Year | Tax Paid | Tax Assessment Tax Assessment Total Assessment is a certain percentage of the fair market value that is determined by local assessors to be the total taxable value of land and additions on the property. | Land | Improvement |
|---|---|---|---|---|
| 2025 | $4,943 | $363,201 | $192,170 | $171,031 |
| 2024 | $4,702 | $356,080 | $188,402 | $167,678 |
| 2023 | $4,702 | $349,099 | $184,708 | $164,391 |
| 2022 | $4,625 | $342,255 | $181,087 | $161,168 |
| 2021 | $4,500 | $335,545 | $177,537 | $158,008 |
| 2019 | $4,404 | $325,594 | $172,272 | $153,322 |
| 2018 | $4,230 | $319,211 | $168,895 | $150,316 |
| 2017 | $4,079 | $312,953 | $165,584 | $147,369 |
| 2016 | $3,951 | $306,818 | $162,338 | $144,480 |
| 2015 | $3,889 | $302,210 | $159,900 | $142,310 |
| 2014 | $3,805 | $296,291 | $156,768 | $139,523 |
Source: Public Records
Map
Nearby Homes
- 1815 Granada Dr
- 1691 Clayton Way
- 3622 Delancey Ln
- 0 Walnut Ave
- 1773 Pinetree Ct
- 3882 Chestnut Ave
- 3824 Beechwood Dr
- 1579 West St
- 1745 Eucalyptus Ct
- 1675 Garnet Ln
- 1849 Silverwood Dr
- 1514 Farm Bureau Rd
- 3479 Rose Ct
- 3641 Clayton Rd Unit 12
- 3641 Clayton Rd Unit 37
- 3641 Clayton Rd Unit 34
- 4050 Sacramento St
- 3901 Clayton Rd Unit 23
- 3901 Clayton Rd Unit 25
- 3466 Willow Pass Rd Unit 54
- 3872 Concord Blvd
- 1795 Clayton Way
- 3866 Logan Ct
- 3874 Logan Ct
- 3858 Logan Ct
- 3860 Concord Blvd
- 3882 Logan Ct
- 3887 Concord Blvd
- 3850 Logan Ct
- 3875 Concord Blvd
- 3867 Logan Ct
- 3901 Concord Blvd
- 3859 Logan Ct
- 1784 Clayton Way
- 1800 Clayton Way
- 3851 Logan Ct
- 3861 Concord Blvd
- 3848 Concord Blvd
- 1803 Gross Ln
- 1809 Clayton Way
Your Personal Tour Guide
Ask me questions while you tour the home.