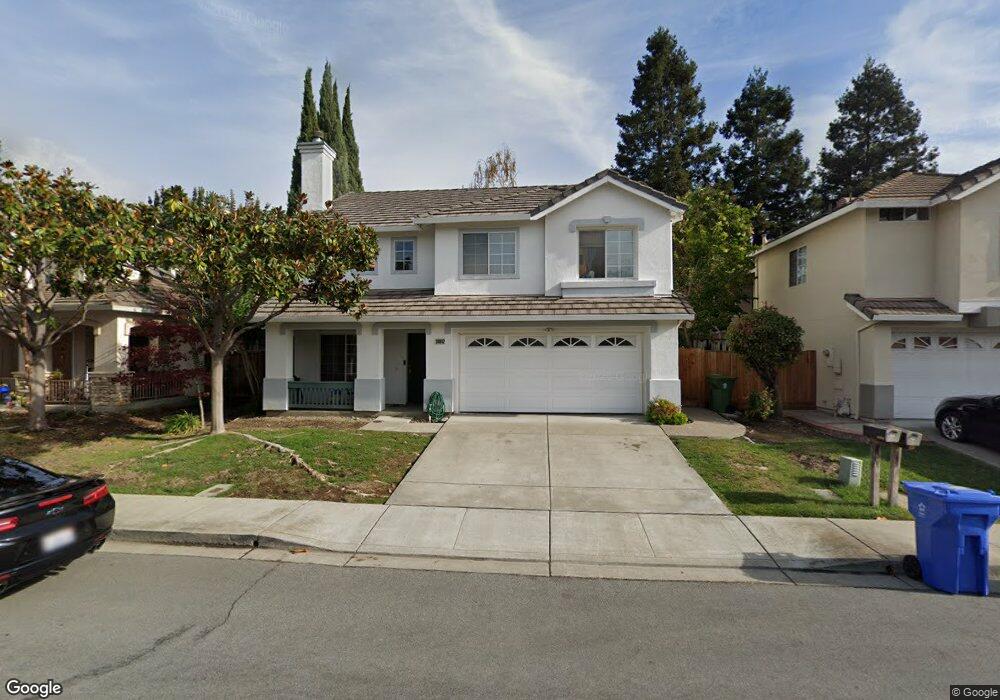
38842 Litchfield Cir Fremont, CA 94536
Cherry-Guardino NeighborhoodEstimated Value: $1,629,000 - $1,796,000
4
Beds
3
Baths
1,579
Sq Ft
$1,063/Sq Ft
Est. Value
About This Home
This home is located at 38842 Litchfield Cir, Fremont, CA 94536 and is currently estimated at $1,678,462, approximately $1,062 per square foot. 38842 Litchfield Cir is a home located in Alameda County with nearby schools including Parkmont Elementary School, Centerville Junior High School, and Washington High School.
Ownership History
Date
Name
Owned For
Owner Type
Purchase Details
Closed on
Jun 4, 2024
Sold by
Tsai Fu Fei
Bought by
Fu Fei Tsai Revocable Trust and Tsai
Current Estimated Value
Purchase Details
Closed on
Aug 27, 1997
Sold by
Sims Alan K and Sims Sheryl H
Bought by
Chang Cheng Tao and Tsai Fu Fei
Home Financials for this Owner
Home Financials are based on the most recent Mortgage that was taken out on this home.
Original Mortgage
$232,800
Interest Rate
7.62%
Purchase Details
Closed on
Aug 11, 1994
Sold by
Kaufman & Broad South Bay Inc
Bought by
Sims Alan K and Sims Sheryl H
Home Financials for this Owner
Home Financials are based on the most recent Mortgage that was taken out on this home.
Original Mortgage
$210,000
Interest Rate
8.7%
Create a Home Valuation Report for This Property
The Home Valuation Report is an in-depth analysis detailing your home's value as well as a comparison with similar homes in the area
Home Values in the Area
Average Home Value in this Area
Purchase History
| Date | Buyer | Sale Price | Title Company |
|---|---|---|---|
| Fu Fei Tsai Revocable Trust | -- | None Listed On Document | |
| Chang Cheng Tao | $333,000 | Golden California Title Co | |
| Sims Alan K | $262,500 | First American Title Guarant |
Source: Public Records
Mortgage History
| Date | Status | Borrower | Loan Amount |
|---|---|---|---|
| Previous Owner | Chang Cheng Tao | $232,800 | |
| Previous Owner | Sims Alan K | $210,000 | |
| Closed | Sims Alan K | $26,250 |
Source: Public Records
Tax History Compared to Growth
Tax History
| Year | Tax Paid | Tax Assessment Tax Assessment Total Assessment is a certain percentage of the fair market value that is determined by local assessors to be the total taxable value of land and additions on the property. | Land | Improvement |
|---|---|---|---|---|
| 2025 | $6,719 | $531,051 | $159,347 | $371,704 |
| 2024 | $6,719 | $520,641 | $156,223 | $364,418 |
| 2023 | $6,531 | $510,434 | $153,161 | $357,273 |
| 2022 | $6,436 | $500,426 | $150,158 | $350,268 |
| 2021 | $6,282 | $490,613 | $147,213 | $343,400 |
| 2020 | $6,261 | $485,586 | $145,705 | $339,881 |
| 2019 | $6,192 | $476,066 | $142,848 | $333,218 |
| 2018 | $6,071 | $466,733 | $140,048 | $326,685 |
| 2017 | $5,920 | $457,583 | $137,302 | $320,281 |
| 2016 | $5,814 | $448,613 | $134,611 | $314,002 |
| 2015 | $5,732 | $441,875 | $132,589 | $309,286 |
| 2014 | $5,630 | $433,220 | $129,992 | $303,228 |
Source: Public Records
Map
Nearby Homes
- 38780 Tyson Ln Unit 205C
- 38780 Tyson Ln Unit 305C
- 1225 Koi Terrace
- 38784 Huntington Cir
- 38538 Tyson Ln
- 38697 Huntington Cir
- 957 Huntington Common
- 38605 Vancouver Common
- 952 Cherry Glen Terrace
- 38627 Cherry Ln Unit 71
- 38623 Cherry Ln Unit 203
- 38623 Cherry Ln Unit 201
- 38623 Cherry Ln Unit 148
- 38623 Cherry Ln Unit 175
- 39239 Walnut Terrace
- 874 Cherry Glen Cir Unit 111
- 1145 Bennett Ct
- 38721 Cherry Ln
- 38851 Stillwater Common
- 39149 Guardino Dr Unit 247
- 38838 Litchfield Cir
- 38846 Litchfield Cir
- 38811 Tyson Ln
- 38821 Tyson Ln
- 38801 Tyson Ln
- 38834 Litchfield Cir
- 38850 Litchfield Cir
- 38843 Litchfield Cir
- 38831 Tyson Ln
- 38791 Tyson Ln
- 38847 Litchfield Cir
- 38839 Litchfield Cir
- 38854 Litchfield Cir
- 38830 Litchfield Cir
- 38851 Litchfield Cir
- 38835 Litchfield Cir
- 38841 Tyson Ln
- 38781 Tyson Ln
- 38855 Litchfield Cir
- 38840 Bluegill St