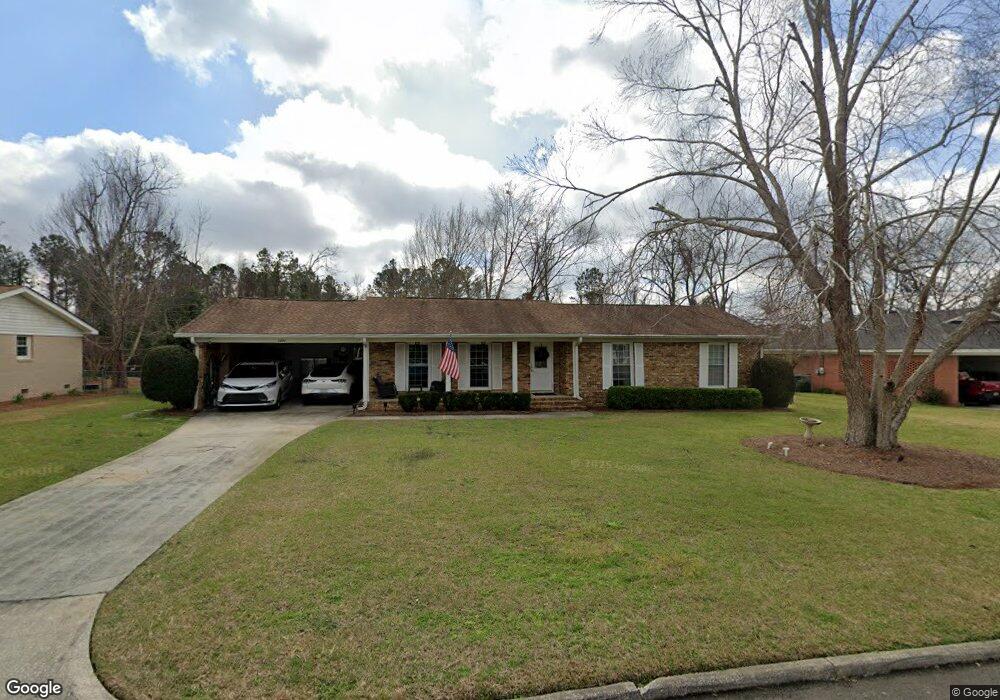
3885 Camellia Dr Valdosta, GA 31605
Estimated Value: $146,000 - $231,000
3
Beds
2
Baths
1,859
Sq Ft
$104/Sq Ft
Est. Value
About This Home
This home is located at 3885 Camellia Dr, Valdosta, GA 31605 and is currently estimated at $193,787, approximately $104 per square foot. 3885 Camellia Dr is a home located in Lowndes County with nearby schools including Dewar Elementary School, Pine Grove Middle School, and Lowndes High School.
Ownership History
Date
Name
Owned For
Owner Type
Purchase Details
Closed on
Dec 6, 2006
Sold by
Barkley John A
Bought by
Barkley John A and Barkley Carment L
Current Estimated Value
Purchase Details
Closed on
Aug 10, 1984
Bought by
Barkley John A
Purchase Details
Closed on
Jul 29, 1981
Bought by
Pitts Donald W
Purchase Details
Closed on
Nov 4, 1979
Bought by
Talbert Lonnie T
Purchase Details
Closed on
Jun 7, 1978
Bought by
Krikorian Steohen Haig
Purchase Details
Closed on
Jul 20, 1976
Bought by
Baden Gerard T Etal
Purchase Details
Closed on
Jul 14, 1976
Bought by
Baden Gerard T
Purchase Details
Closed on
Jul 24, 1974
Bought by
Godfrey W Terry
Purchase Details
Closed on
Apr 11, 1972
Bought by
Leimback Glenn R
Purchase Details
Closed on
Dec 22, 1971
Bought by
Blanchard George A
Create a Home Valuation Report for This Property
The Home Valuation Report is an in-depth analysis detailing your home's value as well as a comparison with similar homes in the area
Home Values in the Area
Average Home Value in this Area
Purchase History
| Date | Buyer | Sale Price | Title Company |
|---|---|---|---|
| Barkley John A | -- | -- | |
| Barkley John A | $10,000 | -- | |
| Pitts Donald W | $5,500 | -- | |
| Talbert Lonnie T | $55,600 | -- | |
| Krikorian Steohen Haig | $43,400 | -- | |
| Baden Gerard T Etal | -- | -- | |
| Baden Gerard T | $3,400 | -- | |
| Godfrey W Terry | $6,600 | -- | |
| Leimback Glenn R | $27,500 | -- | |
| Blanchard George A | $9,000 | -- |
Source: Public Records
Tax History Compared to Growth
Tax History
| Year | Tax Paid | Tax Assessment Tax Assessment Total Assessment is a certain percentage of the fair market value that is determined by local assessors to be the total taxable value of land and additions on the property. | Land | Improvement |
|---|---|---|---|---|
| 2024 | $1,482 | $70,543 | $6,600 | $63,943 |
| 2023 | $1,482 | $60,729 | $6,600 | $54,129 |
| 2022 | $963 | $43,191 | $6,600 | $36,591 |
| 2021 | $1,004 | $43,191 | $6,600 | $36,591 |
| 2020 | $935 | $43,191 | $6,600 | $36,591 |
| 2019 | $944 | $43,191 | $6,600 | $36,591 |
| 2018 | $954 | $43,191 | $6,600 | $36,591 |
| 2017 | $874 | $40,068 | $6,600 | $33,468 |
| 2016 | $876 | $40,068 | $6,600 | $33,468 |
| 2015 | $839 | $40,068 | $6,600 | $33,468 |
| 2014 | $870 | $40,649 | $6,600 | $34,049 |
Source: Public Records
Map
Nearby Homes
- 383 Camellia Dr
- 3448 Bemiss Rd
- 3918 Camellia Dr
- 309 Tomlinson Dr
- 5026 Greyfield Place N
- 3480 Bemiss Rd
- 310 Highland Heights Dr
- 646 Justin Dr
- 4010 Fritz Ln
- 2719 2nd St N
- 3013 Kensington Ln
- 4114 Oak Dr Unit 8
- 2703 Bemiss Rd
- 618 Justin Dr
- 2821 Clayton Dr
- 3016 Ginny Dr
- 4004 Tack Trail
- 3917 Pecan Dr
- 3903 Pecan Dr
- 3604 Bellhaven Dr
- 3887 Camellia Dr
- 3881 Camellia Dr
- 3884 Camellia Dr
- 3886 Camellia Dr
- 3889 Camellia Dr
- 3882 Camellia Dr
- 3892 Camellia Dr
- 3879 Camellia Dr
- 3880 Camellia Dr
- 3891 Camellia Dr
- 3804 Tiffany Place
- 3806 Tiffany Place
- 3802 Tiffany Place
- 3808 Tiffany Place
- 3890 Camellia Dr
- 3878 Camellia Dr
- 3709 Carter Place
- 3703 Carter Place
- 3877 Camellia Dr
- 3893 Camellia Dr