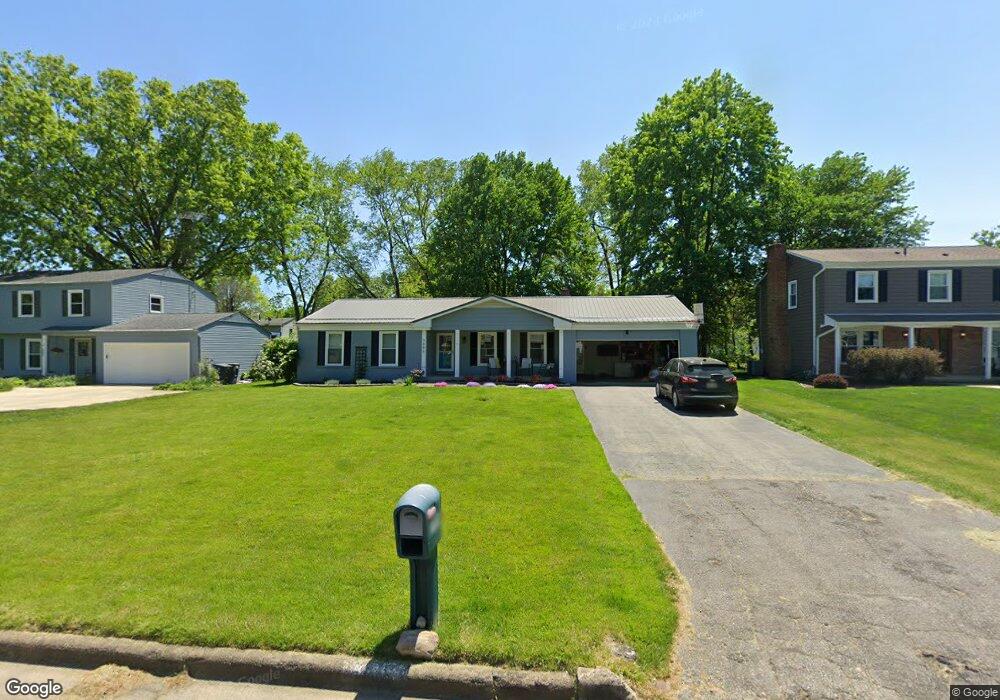
3886 Longhill Dr SE Warren, OH 44484
Hospital NeighborhoodEstimated Value: $205,136 - $253,000
3
Beds
2
Baths
1,496
Sq Ft
$150/Sq Ft
Est. Value
About This Home
This home is located at 3886 Longhill Dr SE, Warren, OH 44484 and is currently estimated at $224,284, approximately $149 per square foot. 3886 Longhill Dr SE is a home located in Trumbull County with nearby schools including Howland High School, Summit Academy Community School - Warren, and John F. Kennedy Catholic School - Lower Campus.
Ownership History
Date
Name
Owned For
Owner Type
Purchase Details
Closed on
Feb 17, 2010
Sold by
Dolsak Donna J and Dolsak Edward J
Bought by
Komlanc Mark and Komlanc Kate
Current Estimated Value
Purchase Details
Closed on
Feb 12, 2010
Sold by
Scarmuzzi Mary Lee and Scarmuzzi Gerald J
Bought by
Dolsak Donna J
Purchase Details
Closed on
May 8, 2006
Sold by
Balintfi Agnes R
Bought by
Scarmuzzi Mary Lee and Dolsak Donna J
Purchase Details
Closed on
Mar 9, 2006
Sold by
Balintfi Agnes R
Bought by
Balintfi Agnes R
Purchase Details
Closed on
Feb 16, 2006
Sold by
Balintfi John V
Bought by
Balintfi Agnes R
Purchase Details
Closed on
Feb 10, 2006
Sold by
Balintfi John V
Bought by
Balintfi Agnes R
Purchase Details
Closed on
Jan 1, 1990
Bought by
John John and John Agnes R
Create a Home Valuation Report for This Property
The Home Valuation Report is an in-depth analysis detailing your home's value as well as a comparison with similar homes in the area
Home Values in the Area
Average Home Value in this Area
Purchase History
| Date | Buyer | Sale Price | Title Company |
|---|---|---|---|
| Komlanc Mark | -- | Attorney | |
| Dolsak Donna J | -- | Attorney | |
| Scarmuzzi Mary Lee | -- | None Available | |
| Balintfi Agnes R | -- | None Available | |
| Balintfi Agnes R | -- | None Available | |
| Balintfi Agnes R | -- | None Available | |
| John John | -- | -- |
Source: Public Records
Tax History Compared to Growth
Tax History
| Year | Tax Paid | Tax Assessment Tax Assessment Total Assessment is a certain percentage of the fair market value that is determined by local assessors to be the total taxable value of land and additions on the property. | Land | Improvement |
|---|---|---|---|---|
| 2024 | $2,392 | $54,530 | $7,910 | $46,620 |
| 2023 | $2,392 | $54,530 | $7,910 | $46,620 |
| 2022 | $1,898 | $37,700 | $7,910 | $29,790 |
| 2021 | $1,899 | $37,700 | $7,910 | $29,790 |
| 2020 | $1,908 | $37,700 | $7,910 | $29,790 |
| 2019 | $1,739 | $32,730 | $7,910 | $24,820 |
| 2018 | $1,723 | $32,730 | $7,910 | $24,820 |
| 2017 | $1,518 | $32,730 | $7,910 | $24,820 |
| 2016 | $1,426 | $30,000 | $9,310 | $20,690 |
| 2015 | $1,428 | $30,000 | $9,310 | $20,690 |
| 2014 | $1,370 | $30,000 | $9,310 | $20,690 |
| 2013 | $1,452 | $32,030 | $9,310 | $22,720 |
Source: Public Records
Map
Nearby Homes
- 3995 Longhill Dr SE
- 3862 Devon Dr SE
- 4079 Greenmont Dr SE
- 0 Broadway Ave SE Unit 5021404
- 3510 E Heights St SE
- 3730 Northwood Dr SE
- 300 Country Club Dr SE
- 568 North Rd SE
- 257 Country Club Dr SE
- 667 North Rd SE
- 1200 Patchen Ave SE
- 3525 Surrey Rd SE
- 1206 Surrey Point Dr SE Unit 1206
- 3793 Bellwood Dr SE
- 153 Royal Troon Dr SE
- 3778 Bellwood Dr SE
- 0 North Rd SE
- 4355 Victoria Terrace SE
- 626 Trumbull Ave SE
- 1523 Edgehill Ave SE
- 3902 Longhill Dr SE
- 3870 Longhill Dr SE
- 3887 Greenmont Dr SE
- 3854 Longhill Dr SE
- 3869 Greenmont Dr SE
- 3887 Longhill Dr SE
- 3855 Greenmont Dr SE
- 3917 Greenmont Dr SE
- 3871 Longhill Dr SE
- 3905 Longhill Dr SE
- 3932 Longhill Dr SE
- 3855 Longhill Dr SE
- 3919 Longhill Dr SE
- 3839 Greenmont Dr SE
- 3935 Greenmont Dr SE
- 3841 Longhill Dr SE
- 3824 Longhill Dr SE
- 3950 Longhill Dr SE
- 909 Thistle Place SE
- 3935 Longhill Dr SE