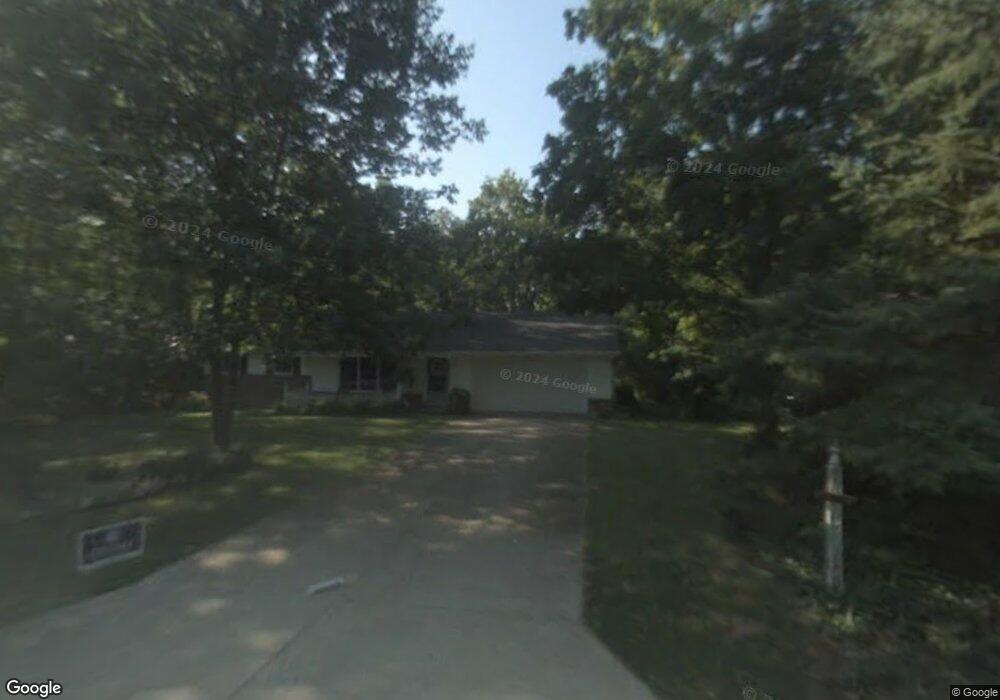
38880 Berkeley Ave Chagrin Falls, OH 44022
Estimated Value: $346,000 - $382,877
2
Beds
2
Baths
1,487
Sq Ft
$243/Sq Ft
Est. Value
About This Home
This home is located at 38880 Berkeley Ave, Chagrin Falls, OH 44022 and is currently estimated at $360,969, approximately $242 per square foot. 38880 Berkeley Ave is a home located in Cuyahoga County with nearby schools including Moreland Hills Elementary School, Ballard Brady Middle School, and Orange High School.
Ownership History
Date
Name
Owned For
Owner Type
Purchase Details
Closed on
Mar 11, 2019
Sold by
Frankel Christine E and Brock Christine Erwin
Bought by
Frankel Drew M and Frankel Christine E
Current Estimated Value
Home Financials for this Owner
Home Financials are based on the most recent Mortgage that was taken out on this home.
Original Mortgage
$168,000
Outstanding Balance
$101,948
Interest Rate
4%
Mortgage Type
New Conventional
Estimated Equity
$259,021
Purchase Details
Closed on
Sep 6, 2002
Sold by
Brock Charles Lance
Bought by
Brock Christine Erwin
Purchase Details
Closed on
Oct 3, 2000
Sold by
Erwin Laura E
Bought by
Brock Charles Lance and Brock Christine Erwin
Home Financials for this Owner
Home Financials are based on the most recent Mortgage that was taken out on this home.
Original Mortgage
$119,939
Interest Rate
7.99%
Mortgage Type
FHA
Purchase Details
Closed on
Nov 29, 1982
Sold by
Erwin Roy and Erwin Laura E
Bought by
Erwin Laura E
Purchase Details
Closed on
Jan 1, 1975
Bought by
Erwin Roy and Erwin Laura E
Create a Home Valuation Report for This Property
The Home Valuation Report is an in-depth analysis detailing your home's value as well as a comparison with similar homes in the area
Home Values in the Area
Average Home Value in this Area
Purchase History
We collect this data history from publicly available records. To have your information removed, we recommend requesting removal directly through your county’s website.
| Date | Buyer | Sale Price | Title Company |
|---|---|---|---|
| Frankel Drew M | -- | Solidifi Title | |
| Brock Christine Erwin | -- | -- | |
| Brock Charles Lance | $120,000 | Real Estate Title | |
| Erwin Laura E | -- | -- | |
| Erwin Roy | -- | -- |
Source: Public Records
Mortgage History
We collect this data history from publicly available records. To have your information removed, we recommend requesting removal directly through your county’s website.
| Date | Status | Borrower | Loan Amount |
|---|---|---|---|
| Open | Frankel Drew M | $168,000 | |
| Closed | Brock Charles Lance | $119,939 |
Source: Public Records
Tax History
| Year | Tax Paid | Tax Assessment Tax Assessment Total Assessment is a certain percentage of the fair market value that is determined by local assessors to be the total taxable value of land and additions on the property. | Land | Improvement |
|---|---|---|---|---|
| 2025 | $6,228 | $110,285 | $19,810 | $90,475 |
| 2024 | $6,232 | $110,285 | $19,810 | $90,475 |
| 2023 | $4,983 | $74,870 | $18,480 | $56,390 |
| 2022 | $4,989 | $74,870 | $18,480 | $56,390 |
| 2021 | $4,937 | $74,870 | $18,480 | $56,390 |
| 2020 | $4,682 | $66,260 | $16,350 | $49,910 |
| 2019 | $4,329 | $181,000 | $46,700 | $134,300 |
| 2018 | $4,303 | $63,350 | $16,350 | $47,010 |
| 2017 | $3,809 | $55,930 | $15,190 | $40,740 |
| 2016 | $3,764 | $55,930 | $15,190 | $40,740 |
| 2015 | $3,617 | $55,930 | $15,190 | $40,740 |
| 2014 | $3,617 | $52,260 | $14,210 | $38,050 |
Source: Public Records
Map
Nearby Homes
- 3812 Ellendale Rd
- 3940 Ellendale Rd
- 35 Murwood Dr
- 25 Brandon Ct
- 60 South Ln
- 35320 Chagrin Blvd
- 3450 Roundwood Rd
- 25 Hopewell Trail
- 165 Hickory Ln
- 0 Lancaster Ct
- 34100 Chagrin Blvd Unit 1101
- 33300 S Woodland Rd
- 34104 Chagrin Blvd Unit 3102
- 312 Woodridge Ln
- 336 Woodridge Ln
- 32899 Pinetree Rd
- 6055 Deepwood Dr
- 3190 Roundwood Rd
- 20 Kenton Rd
- 32750 Meadow Lark Way
- 38700 Berkeley Ave
- 38520 Berkeley Ave
- 38879 Berkeley Ave
- 38519 Berkeley Ave
- 38889 Berkeley Ave
- 38551 Berkeley Ave
- 38340 Berkeley Ave
- 38909 Berkeley Ave
- 38339 Berkeley Ave
- 38210 Berkeley Ave
- 38209 Berkeley Ave
- 38919 Berkeley Ave
- 38109 Berkeley Ave
- 38080 Berkeley Ave
- 38089 Berkeley Ave
- 38929 Berkeley Ave
- 38940 Berkeley Ave
- 37960 Berkeley Ave
- 37950 Berkeley Ave
- 37940 Berkeley Ave
Your Personal Tour Guide
Ask me questions while you tour the home.