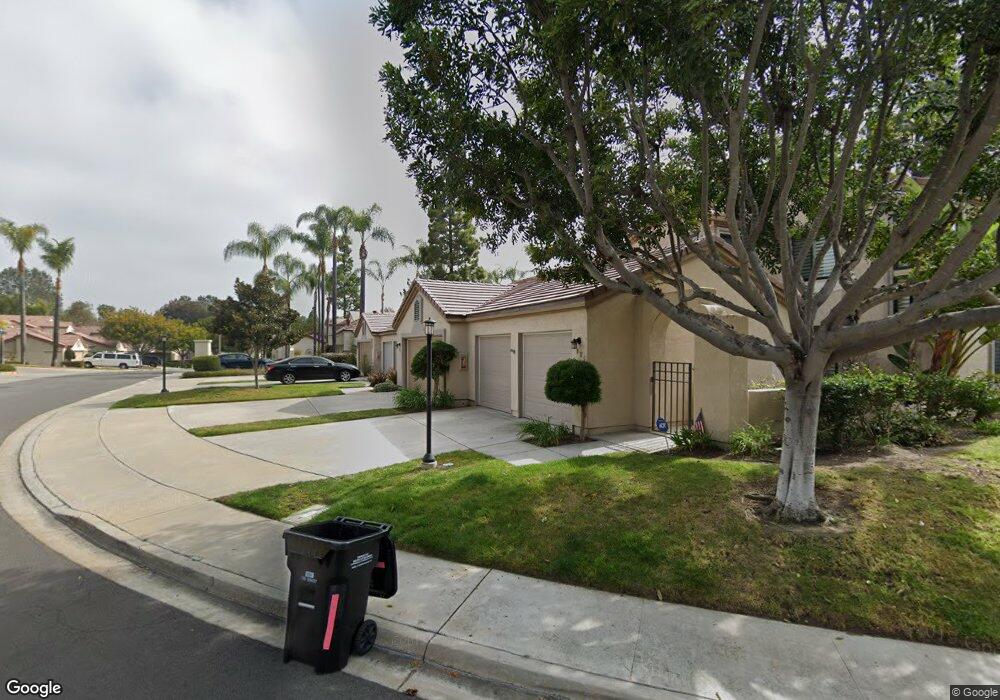
3889 Fallon Cir San Diego, CA 92130
Carmel Valley NeighborhoodEstimated Value: $1,300,000 - $1,405,000
3
Beds
3
Baths
1,602
Sq Ft
$843/Sq Ft
Est. Value
About This Home
This home is located at 3889 Fallon Cir, San Diego, CA 92130 and is currently estimated at $1,351,244, approximately $843 per square foot. 3889 Fallon Cir is a home located in San Diego County with nearby schools including Solana Highlands Elementary School, Carmel Valley Middle School, and Torrey Pines High School.
Ownership History
Date
Name
Owned For
Owner Type
Purchase Details
Closed on
Apr 1, 2021
Sold by
Finley Michael C and Shapiro Sally
Bought by
Finley Michael C and Shapiro Sally
Current Estimated Value
Home Financials for this Owner
Home Financials are based on the most recent Mortgage that was taken out on this home.
Original Mortgage
$510,400
Outstanding Balance
$461,565
Interest Rate
3.1%
Mortgage Type
New Conventional
Estimated Equity
$889,679
Purchase Details
Closed on
May 29, 2020
Sold by
Finley Michael C and Shapiro Sally
Bought by
Shapiro Michael C and Shapiro Sally
Home Financials for this Owner
Home Financials are based on the most recent Mortgage that was taken out on this home.
Original Mortgage
$680,000
Interest Rate
3.2%
Mortgage Type
New Conventional
Purchase Details
Closed on
Jun 27, 2019
Sold by
Simmons Kathleen D
Bought by
Finley Michael C and Shapiro Sally
Home Financials for this Owner
Home Financials are based on the most recent Mortgage that was taken out on this home.
Original Mortgage
$850,000
Interest Rate
3.9%
Mortgage Type
Commercial
Purchase Details
Closed on
Sep 10, 2001
Sold by
Friend Jennifer
Bought by
Simmons Kathleen D
Home Financials for this Owner
Home Financials are based on the most recent Mortgage that was taken out on this home.
Original Mortgage
$275,000
Interest Rate
6.91%
Mortgage Type
Purchase Money Mortgage
Purchase Details
Closed on
Aug 23, 2000
Sold by
Friend Nancy Alexandra Sandra
Bought by
Friend Jennifer
Purchase Details
Closed on
Sep 27, 1999
Sold by
Jennifer Friend
Bought by
Friend Jennifer and Friend Nancy Alexandra Sandra
Purchase Details
Closed on
Nov 18, 1998
Sold by
Jennifer Friend and Friend Nancy A S Trust
Bought by
Friend Jennifer
Home Financials for this Owner
Home Financials are based on the most recent Mortgage that was taken out on this home.
Original Mortgage
$225,000
Interest Rate
6.78%
Mortgage Type
Stand Alone First
Purchase Details
Closed on
Jan 5, 1994
Sold by
Friend Sandra
Bought by
Friend Nancy Alexandra Sandra
Purchase Details
Closed on
Dec 21, 1993
Sold by
Friend Nancy Alexandra Sandra
Bought by
Friend Sandra
Purchase Details
Closed on
Dec 10, 1993
Sold by
Green Raymond
Bought by
Friend Jennifer
Purchase Details
Closed on
Apr 7, 1992
Purchase Details
Closed on
Mar 7, 1989
Purchase Details
Closed on
May 14, 1987
Create a Home Valuation Report for This Property
The Home Valuation Report is an in-depth analysis detailing your home's value as well as a comparison with similar homes in the area
Home Values in the Area
Average Home Value in this Area
Purchase History
| Date | Buyer | Sale Price | Title Company |
|---|---|---|---|
| Finley Michael C | -- | Accommodation | |
| Finley Michael C | -- | First American Title | |
| Shapiro Michael C | -- | Accommodation | |
| Finley Michael C | -- | First American Title Company | |
| Finley Michael C | $850,000 | Guardian Title Company | |
| Simmons Kathleen D | $420,000 | First American Title | |
| Friend Jennifer | -- | Guardian Title Company | |
| Friend Jennifer | -- | First American Title | |
| Friend Jennifer | -- | First American Title | |
| Friend Nancy Alexandra Sandra | -- | First American Title Co | |
| Friend Sandra | -- | Commonwealth Land Title Co | |
| Friend Jennifer | -- | Commonwealth Land Title Co | |
| -- | $237,500 | -- | |
| -- | $234,900 | -- | |
| -- | $166,500 | -- |
Source: Public Records
Mortgage History
| Date | Status | Borrower | Loan Amount |
|---|---|---|---|
| Open | Finley Michael C | $510,400 | |
| Closed | Finley Michael C | $680,000 | |
| Closed | Finley Michael C | $850,000 | |
| Previous Owner | Simmons Kathleen D | $275,000 | |
| Previous Owner | Friend Jennifer | $225,000 |
Source: Public Records
Tax History Compared to Growth
Tax History
| Year | Tax Paid | Tax Assessment Tax Assessment Total Assessment is a certain percentage of the fair market value that is determined by local assessors to be the total taxable value of land and additions on the property. | Land | Improvement |
|---|---|---|---|---|
| 2025 | $9,738 | $929,594 | $525,476 | $404,118 |
| 2024 | $9,738 | $911,368 | $515,173 | $396,195 |
| 2023 | $9,523 | $893,499 | $505,072 | $388,427 |
| 2022 | $9,367 | $875,980 | $495,169 | $380,811 |
| 2021 | $9,203 | $858,805 | $485,460 | $373,345 |
| 2020 | $9,197 | $850,000 | $480,483 | $369,517 |
| 2019 | $5,973 | $556,199 | $314,405 | $241,794 |
| 2018 | $5,859 | $545,294 | $308,241 | $237,053 |
| 2017 | $81 | $534,603 | $302,198 | $232,405 |
| 2016 | $5,412 | $524,122 | $296,273 | $227,849 |
| 2015 | $5,403 | $516,250 | $291,823 | $224,427 |
| 2014 | $5,293 | $506,138 | $286,107 | $220,031 |
Source: Public Records
Map
Nearby Homes
- 3606 Bernwood Place Unit 14
- 3539 Voyager Cir Unit 15
- 13074 Maritime Place Unit 1
- 3510 Voyager Cir Unit 67
- 3856 Quarter Mile Dr
- 3857 Pell Place Unit 406
- 13398 Tiverton Rd
- 13413 Landfair Rd
- 3872 Creststone Place
- 3877 Pell Place Unit 424
- 3877 Pell Place Unit 225
- 3936 Ambervale Terrace
- 12936 Carmel Creek Rd Unit 63
- 12620 Carmel Country Rd Unit 74
- 13264 Kibbings Rd Unit 5
- 13323 Kibbings Rd
- 12585 Ruette Alliante Unit 152
- 12364 Carmel Country Rd Unit C306
- 3550 Caminito el Rincon Unit 69
- 4049 Carmel View Rd Unit 74
- 3893 Fallon Cir
- 3897 Fallon Cir
- 3885 Fallon Cir
- 3894 Fallon Cir
- 3601 Fallon Cir
- 3892 Fallon Cir Unit 2
- 3888 Fallon Cir Unit 3
- 3603 Fallon Cir
- 3886 Fallon Cir
- 3605 Fallon Cir
- 3602 Fallon Cir
- 3604 Fallon Cir
- 3872 Fallon Cir
- 3856 Fallon Cir Unit 14
- 3810 Fallon Cir
- 3808 Fallon Cir
- 3606 Fallon Cir Unit 96
- 3874 Fallon Cir
- 3816 Fallon Cir Unit 27
- 3818 Fallon Cir