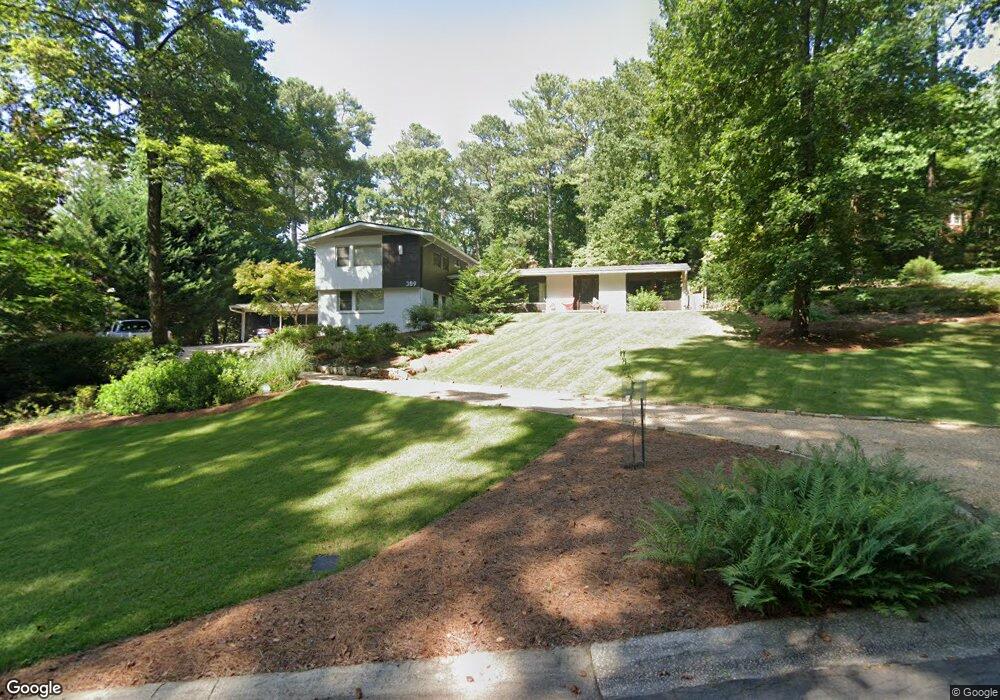
389 Chinquapin Dr SW Marietta, GA 30064
Southwestern Marietta NeighborhoodEstimated Value: $657,000 - $812,000
4
Beds
3
Baths
3,642
Sq Ft
$207/Sq Ft
Est. Value
About This Home
This home is located at 389 Chinquapin Dr SW, Marietta, GA 30064 and is currently estimated at $754,254, approximately $207 per square foot. 389 Chinquapin Dr SW is a home located in Cobb County with nearby schools including Hickory Hills Elementary School, Marietta Sixth Grade Academy, and Marietta Middle School.
Ownership History
Date
Name
Owned For
Owner Type
Purchase Details
Closed on
Dec 8, 2008
Sold by
Foster Gary W and Foster Lane H
Bought by
Hlatt Clayton A and Warren James
Current Estimated Value
Home Financials for this Owner
Home Financials are based on the most recent Mortgage that was taken out on this home.
Original Mortgage
$331,200
Outstanding Balance
$217,622
Interest Rate
6.1%
Mortgage Type
New Conventional
Estimated Equity
$536,632
Purchase Details
Closed on
Aug 12, 2005
Sold by
Condon Brian D and Condon Tracy
Bought by
Foster Gary W and Foster Lane
Home Financials for this Owner
Home Financials are based on the most recent Mortgage that was taken out on this home.
Original Mortgage
$349,700
Interest Rate
5.13%
Mortgage Type
New Conventional
Purchase Details
Closed on
May 14, 2004
Sold by
Hawkins Daniel A and Hawkins Lynda D
Bought by
Condon Brian D and Condon Tracy
Home Financials for this Owner
Home Financials are based on the most recent Mortgage that was taken out on this home.
Original Mortgage
$168,000
Interest Rate
5.63%
Mortgage Type
New Conventional
Create a Home Valuation Report for This Property
The Home Valuation Report is an in-depth analysis detailing your home's value as well as a comparison with similar homes in the area
Home Values in the Area
Average Home Value in this Area
Purchase History
| Date | Buyer | Sale Price | Title Company |
|---|---|---|---|
| Hlatt Clayton A | $414,000 | -- | |
| Foster Gary W | $437,200 | -- | |
| Condon Brian D | $240,000 | -- |
Source: Public Records
Mortgage History
| Date | Status | Borrower | Loan Amount |
|---|---|---|---|
| Open | Hlatt Clayton A | $331,200 | |
| Previous Owner | Foster Gary W | $349,700 | |
| Previous Owner | Condon Brian D | $168,000 |
Source: Public Records
Tax History Compared to Growth
Tax History
| Year | Tax Paid | Tax Assessment Tax Assessment Total Assessment is a certain percentage of the fair market value that is determined by local assessors to be the total taxable value of land and additions on the property. | Land | Improvement |
|---|---|---|---|---|
| 2025 | $1,346 | $231,808 | $98,000 | $133,808 |
| 2024 | $1,346 | $231,808 | $98,000 | $133,808 |
| 2023 | $1,194 | $237,784 | $88,000 | $149,784 |
| 2022 | $1,346 | $181,984 | $87,000 | $94,984 |
| 2021 | $1,370 | $181,984 | $87,000 | $94,984 |
| 2020 | $1,312 | $162,552 | $67,000 | $95,552 |
| 2019 | $1,277 | $158,552 | $63,000 | $95,552 |
| 2018 | $1,191 | $148,540 | $60,000 | $88,540 |
| 2017 | $805 | $126,700 | $46,000 | $80,700 |
| 2016 | $806 | $126,700 | $46,000 | $80,700 |
| 2015 | $898 | $129,256 | $46,000 | $83,256 |
| 2014 | $928 | $129,256 | $0 | $0 |
Source: Public Records
Map
Nearby Homes
- 305 Brookwood Dr SW
- 479 Banks St SW
- 375 Leisure Ct SW
- 563 Hillandale Cir SW
- 662 Bouldercrest Dr SW
- 199 Brookwood Dr SW
- 681 Hampton Place SW
- 916 Cannongate Crossing SW Unit 916
- 916 Cannon Gate Crossing
- 1011 Cannongate Crossing SW
- 1017 Cannongate Crossing SW
- 873 Cavalry Dr SW
- 838 Cannon Run SW
- 798 Sentinel Ridge SW
- 237 Toweridge Dr SW
- 1121 Cannongate Crossing SW
- 834 Cannon Run SW
- 839 Manning Villas Ct SW
- 473 Chestnut Dr SW
- 407 Chinquapin Dr SW
- 463 Chestnut Dr SW
- 392 Chinquapin Dr SW
- 384 Chinquapin Dr SW
- 404 S Woodland Dr SW
- 402 Chinquapin Dr SW
- 421 Chinquapin Dr SW
- 392 S Woodland Dr SW
- 380 Chinquapin Dr SW
- 414 S Woodland Dr SW
- 410 Chinquapin Dr SW
- 0 Chestnut Dr Unit 7217956
- 0 Chestnut Dr
- 474 Chestnut Dr SW
- 504 Chestnut Dr SW
- 376 Chinquapin Dr SW
- 448 Chestnut Dr SW
- 418 Chinquapin Dr SW
- S S Woodland Dr SW Unit 143