Estimated Value: $518,000 - $614,000
4
Beds
2
Baths
1,788
Sq Ft
$308/Sq Ft
Est. Value
About This Home
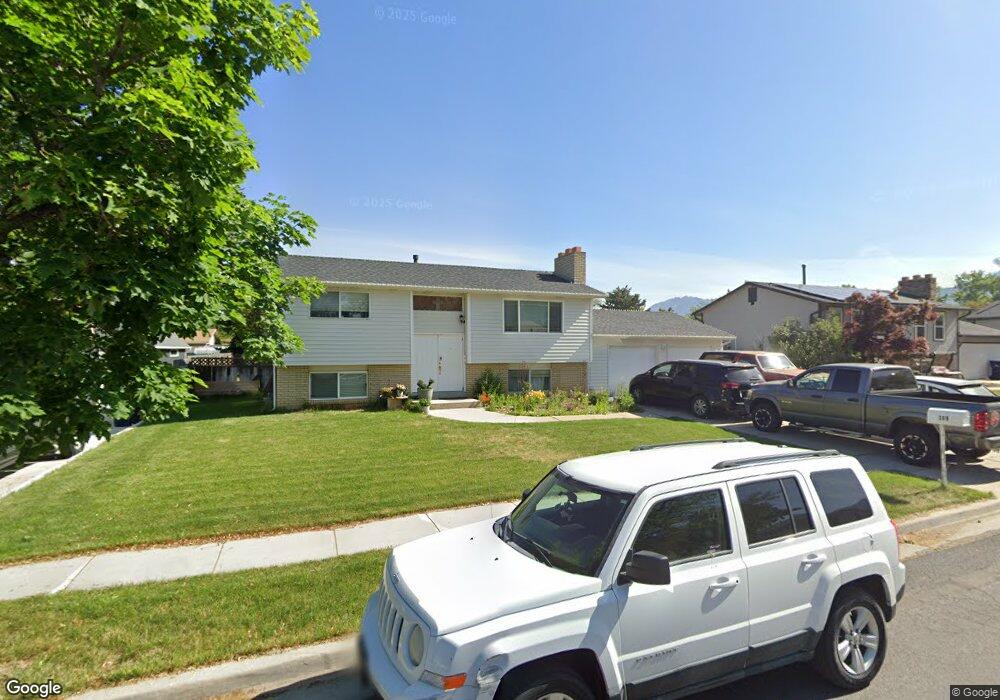
This home is located at 389 E 10185 S, Sandy, UT 84070 and is currently estimated at $550,779, approximately $308 per square foot. 389 E 10185 S is a home located in Salt Lake County with nearby schools including Alta View Elementary School, Jordan High, and Mount Jordan Middle School.
Ownership History
Date
Name
Owned For
Owner Type
Purchase Details
Closed on
Aug 17, 2018
Sold by
Odobasic Suada
Bought by
Odobasic Samir and Odobasic Suada
Current Estimated Value
Purchase Details
Closed on
Sep 14, 2016
Sold by
Pollock Jeralyn
Bought by
Odobasic Suada
Purchase Details
Closed on
Apr 25, 2005
Sold by
Capece Thomas Frank and Capece Kathy
Bought by
Pollock Jeralyn
Home Financials for this Owner
Home Financials are based on the most recent Mortgage that was taken out on this home.
Original Mortgage
$128,000
Interest Rate
5.92%
Mortgage Type
Stand Alone First
Purchase Details
Closed on
Jan 24, 2005
Sold by
Capece Thomas F and Capece Kathy
Bought by
Capece Thomas Frank and Capece Kathy
Home Financials for this Owner
Home Financials are based on the most recent Mortgage that was taken out on this home.
Original Mortgage
$50,000
Interest Rate
5.67%
Mortgage Type
Credit Line Revolving
Create a Home Valuation Report for This Property
The Home Valuation Report is an in-depth analysis detailing your home's value as well as a comparison with similar homes in the area
Home Values in the Area
Average Home Value in this Area
Purchase History
| Date | Buyer | Sale Price | Title Company |
|---|---|---|---|
| Odobasic Samir | -- | Accommodation | |
| Odobasic Suada | -- | First American Title | |
| Pollock Jeralyn | -- | Integrated Title Ins Svcs | |
| Capece Thomas Frank | -- | Cpr Title | |
| Capece Thomas F | -- | Cpr Title |
Source: Public Records
Mortgage History
| Date | Status | Borrower | Loan Amount |
|---|---|---|---|
| Previous Owner | Pollock Jeralyn | $128,000 | |
| Previous Owner | Capece Thomas F | $50,000 | |
| Closed | Pollock Jeralyn | $32,000 |
Source: Public Records
Tax History
| Year | Tax Paid | Tax Assessment Tax Assessment Total Assessment is a certain percentage of the fair market value that is determined by local assessors to be the total taxable value of land and additions on the property. | Land | Improvement |
|---|---|---|---|---|
| 2025 | $2,367 | $468,900 | $124,800 | $344,100 |
| 2024 | $2,367 | $447,600 | $119,100 | $328,500 |
| 2023 | $2,056 | $388,500 | $113,200 | $275,300 |
| 2022 | $2,169 | $400,600 | $111,000 | $289,600 |
| 2021 | $1,922 | $302,300 | $85,900 | $216,400 |
| 2020 | $1,835 | $272,600 | $85,900 | $186,700 |
| 2019 | $1,741 | $252,300 | $81,100 | $171,200 |
| 2016 | $1,460 | $204,900 | $81,100 | $123,800 |
Source: Public Records
Map
Nearby Homes
- 10218 S Sandy Willows Cove
- 586 E 10345 S
- 639 E Calnette Dr
- 569 E Aloha Ln
- 574 E 10425 S
- 9822 S Darin Dr
- 10106 S Peony Way
- 375 E 10560 S
- 10556 S Sandy Sage Way
- 601 E Pali St
- 717 Sand Dollar Dr
- 10351 S Zinnia Way
- 8475 S State St
- 10564 S Weeping Willow Dr
- 10510 S State St
- 101 E Rembrandt Cir
- 10491 Amaryllis St
- 10522 Amaryllis St
- 77 W Evening Star Way
- 837 E 10515 S
Your Personal Tour Guide
Ask me questions while you tour the home.