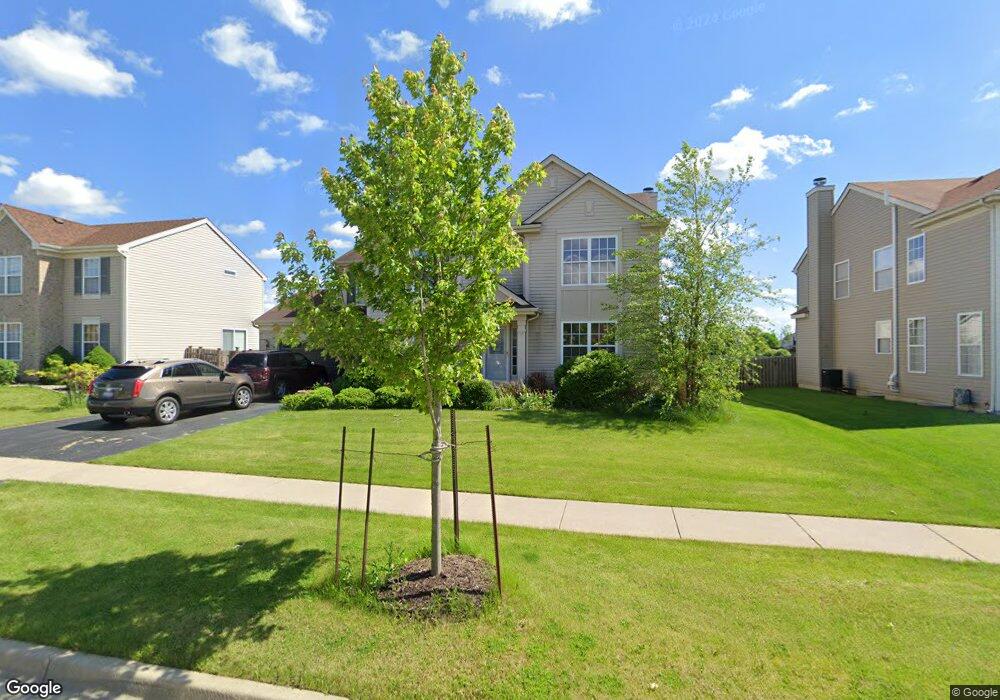
389 Horizon Ln Dekalb, IL 60115
Estimated Value: $305,063 - $365,000
4
Beds
3
Baths
--
Sq Ft
8,712
Sq Ft Lot
About This Home
This home is located at 389 Horizon Ln, Dekalb, IL 60115 and is currently estimated at $332,766. 389 Horizon Ln is a home located in DeKalb County with nearby schools including Malta Elementary School, Huntley Middle School, and De Kalb High School.
Ownership History
Date
Name
Owned For
Owner Type
Purchase Details
Closed on
Jul 29, 2022
Sold by
Martenson Douglas S
Bought by
Martenson Jeffrey B
Current Estimated Value
Home Financials for this Owner
Home Financials are based on the most recent Mortgage that was taken out on this home.
Original Mortgage
$135,000
Outstanding Balance
$114,826
Interest Rate
4.99%
Mortgage Type
New Conventional
Estimated Equity
$217,940
Purchase Details
Closed on
Aug 17, 2009
Sold by
Indymac Bank
Bought by
Martenson Douglas
Purchase Details
Closed on
Mar 12, 2009
Sold by
Dekalb County Sheriff
Bought by
Indymac Bank
Purchase Details
Closed on
Mar 4, 2009
Sold by
Dekalb County Sheriff
Bought by
Indymac Bank
Purchase Details
Closed on
Mar 16, 2005
Sold by
Wiseman Hughes Enterprises Inc
Bought by
Rhinerson Justin
Home Financials for this Owner
Home Financials are based on the most recent Mortgage that was taken out on this home.
Original Mortgage
$211,741
Interest Rate
5.61%
Mortgage Type
New Conventional
Create a Home Valuation Report for This Property
The Home Valuation Report is an in-depth analysis detailing your home's value as well as a comparison with similar homes in the area
Home Values in the Area
Average Home Value in this Area
Purchase History
| Date | Buyer | Sale Price | Title Company |
|---|---|---|---|
| Martenson Jeffrey B | $230,000 | Klein Stoddard Buck & Lewis Ll | |
| Martenson Douglas | $178,000 | -- | |
| Indymac Bank | -- | -- | |
| Indymac Bank | -- | -- | |
| Rhinerson Justin | $265,000 | -- |
Source: Public Records
Mortgage History
| Date | Status | Borrower | Loan Amount |
|---|---|---|---|
| Open | Martenson Jeffrey B | $135,000 | |
| Previous Owner | Rhinerson Justin | $211,741 |
Source: Public Records
Tax History
| Year | Tax Paid | Tax Assessment Tax Assessment Total Assessment is a certain percentage of the fair market value that is determined by local assessors to be the total taxable value of land and additions on the property. | Land | Improvement |
|---|---|---|---|---|
| 2024 | $6,744 | $89,049 | $12,420 | $76,629 |
| 2023 | $6,557 | $77,643 | $10,829 | $66,814 |
| 2022 | $6,557 | $70,888 | $12,359 | $58,529 |
| 2021 | $6,694 | $66,487 | $11,592 | $54,895 |
| 2020 | $6,834 | $65,427 | $11,407 | $54,020 |
| 2019 | $6,672 | $62,856 | $10,959 | $51,897 |
| 2018 | $6,490 | $60,724 | $10,587 | $50,137 |
| 2017 | $6,523 | $58,372 | $10,177 | $48,195 |
| 2016 | $6,432 | $56,898 | $9,920 | $46,978 |
| 2015 | -- | $53,911 | $9,399 | $44,512 |
| 2014 | -- | $53,506 | $13,600 | $39,906 |
| 2013 | -- | $56,204 | $14,286 | $41,918 |
Source: Public Records
Map
Nearby Homes
- 451 Thresher St
- 476 Thresher St
- 1663 Furrow St
- 1692 Furrow St
- 1748 Furrow St
- 1723 Goldenrod Turn
- 399 Bantam St
- 1734 Sunglow Ln
- 1177 Golf Ct
- 1169 Golf Ct
- 1212 Bellevue Dr
- 430 Turnbury Ct E
- 838 Glidden Ave
- 714 Ellwood Ave
- 925 Haish Blvd
- 612 Russell Rd
- 673 Haish Blvd
- Lot 4 N Annie Glidden Rd
- 631 Haish Blvd
- 1205 S 1st St
- 391 Horizon Ln
- 385 Horizon Ln
- 425 Haystack Ct
- 393 Horizon Ln
- 381 Horizon Ln
- 429 Haystack Ct
- 388 Horizon Ln
- 390 Horizon Ln
- 386 Horizon Ln
- 395 Horizon Ln
- 392 Horizon Ln
- 412 Settler Rd
- 384 Horizon Ln
- 428 Haystack Ct
- 420 Settler Rd
- 441 Haystack Ct
- 394 Horizon Ln
- 411 Horizon Ln
- 382 Horizon Ln
- 444 Settler Rd
Your Personal Tour Guide
Ask me questions while you tour the home.