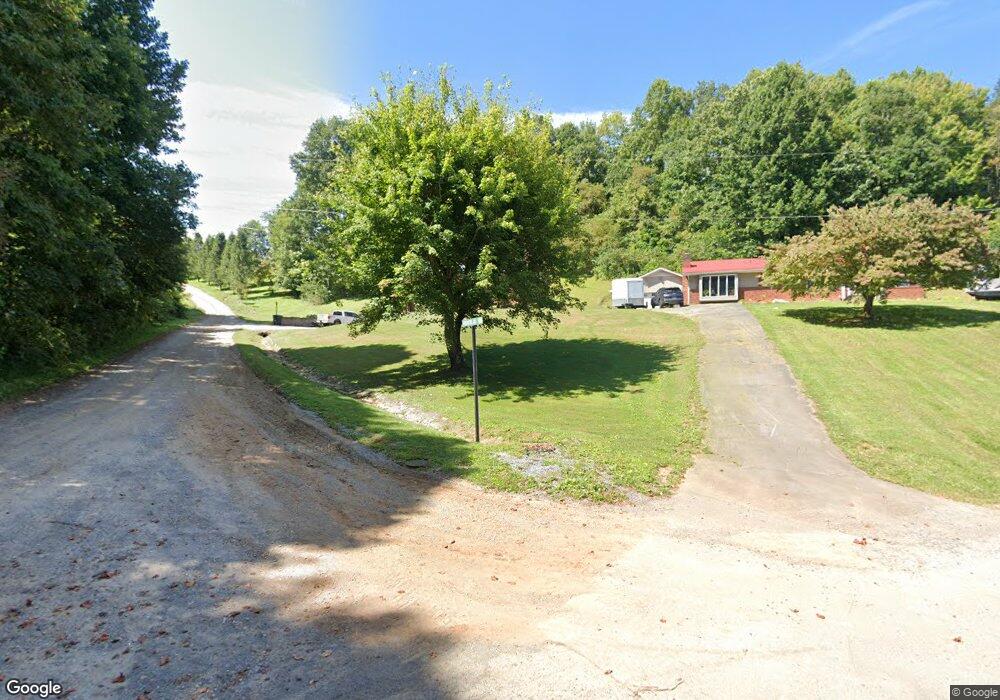
389 Jenkins Hollow Rd Elizabethton, TN 37643
Estimated Value: $144,999 - $265,000
--
Bed
1
Bath
1,188
Sq Ft
$173/Sq Ft
Est. Value
About This Home
This home is located at 389 Jenkins Hollow Rd, Elizabethton, TN 37643 and is currently estimated at $205,250, approximately $172 per square foot. 389 Jenkins Hollow Rd is a home located in Carter County with nearby schools including East Tn Christian Home & Academy.
Ownership History
Date
Name
Owned For
Owner Type
Purchase Details
Closed on
Jun 28, 2022
Sold by
Darrel Andrews James
Bought by
Andrews James M
Current Estimated Value
Purchase Details
Closed on
Dec 1, 1982
Bought by
Andrews Lena Dee Etvir James Darrel
Create a Home Valuation Report for This Property
The Home Valuation Report is an in-depth analysis detailing your home's value as well as a comparison with similar homes in the area
Home Values in the Area
Average Home Value in this Area
Purchase History
| Date | Buyer | Sale Price | Title Company |
|---|---|---|---|
| Andrews James M | -- | Hardin Joshua A | |
| Andrews James M | -- | Hardin Joshua A | |
| Andrews Lena Dee Etvir James Darrel | -- | -- |
Source: Public Records
Tax History Compared to Growth
Tax History
| Year | Tax Paid | Tax Assessment Tax Assessment Total Assessment is a certain percentage of the fair market value that is determined by local assessors to be the total taxable value of land and additions on the property. | Land | Improvement |
|---|---|---|---|---|
| 2024 | $617 | $28,300 | $5,400 | $22,900 |
| 2023 | $617 | $28,300 | $0 | $0 |
| 2022 | $574 | $28,300 | $5,400 | $22,900 |
| 2021 | $574 | $28,300 | $5,400 | $22,900 |
| 2020 | $543 | $28,300 | $5,400 | $22,900 |
| 2019 | $543 | $21,975 | $3,150 | $18,825 |
| 2018 | $534 | $21,625 | $3,150 | $18,475 |
| 2017 | $534 | $21,625 | $3,150 | $18,475 |
| 2016 | $530 | $21,625 | $3,150 | $18,475 |
| 2015 | $530 | $21,625 | $3,150 | $18,475 |
| 2014 | $539 | $22,000 | $3,150 | $18,850 |
Source: Public Records
Map
Nearby Homes
- 637 Long Hollow Rd
- 278 Long Hollow Rd
- TBD River Rd
- 220 Jenkins Hollow Rd
- Tbd Hampton Dr
- 118 Mountain View Cir
- 109 Yard Hill Rd
- 133 Hickory Hollow Rd
- Tbd Cannon Hill Dr
- 105 Meredith Dr
- 1439 Riverview Dr
- Lot 8 Emerald Hills Dr
- Lots 5&6 Emerald Hills Dr
- Lot 1 Emerald Hills Dr
- Lots 4567 Emerald Hills Dr
- 200 Franklin Ln
- 117 Icy Ln
- Tbd Icy Ln
- 136 Ruby Ave
- 2600 State Line Rd
- 0 Andrews Dr
- 391 Jenkins Hollow Rd
- 112 Andrews Dr
- 397 Jenkins Hollow Rd
- 115 Andrews Dr
- 387 Jenkins Hollow Rd
- 407 Jenkins Hollow Rd
- 413 Jenkins Hollow Rd
- 384 Jenkins Hollow Rd
- 381 Jenkins Hollow Rd
- 421 Jenkins Hollow Rd
- 132 Andrews Dr
- 375 Jenkins Hollow Rd
- 372 Jenkins Hollow Rd
- 371 Jenkins Hollow Rd
- 382 Jenkins Hollow Rd
- 368 Jenkins Hollow Rd
- 367 Jenkins Hollow Rd
- 455 Jenkins Hollow Rd
- 360 Jenkins Hollow Rd