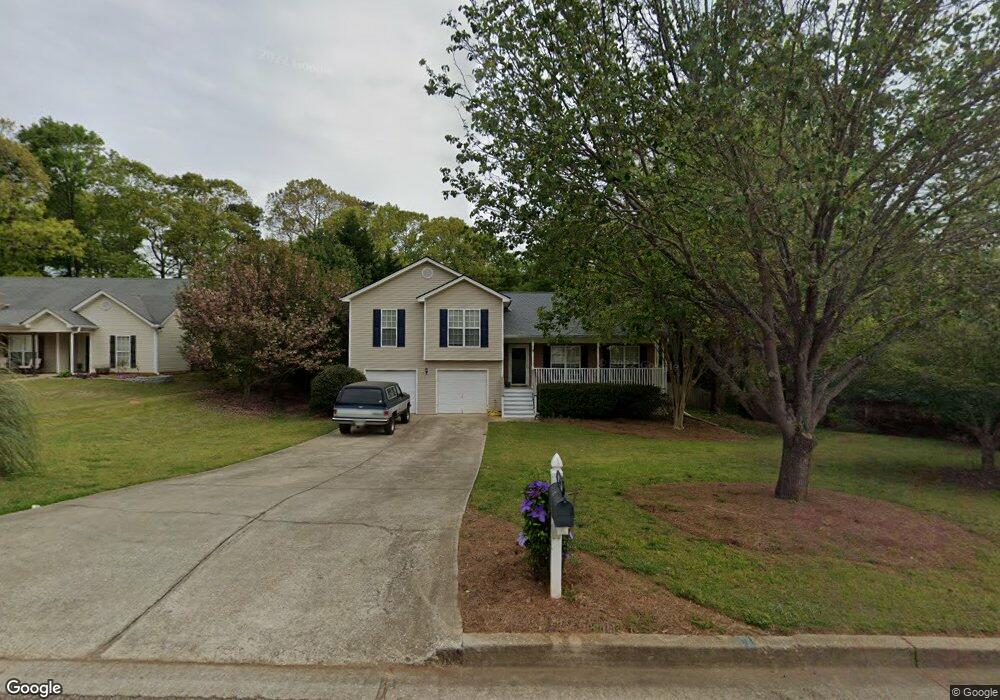
389 Lokeys Ridge Rd Unit 43A Bethlehem, GA 30620
Estimated Value: $327,000 - $357,000
4
Beds
3
Baths
1,883
Sq Ft
$181/Sq Ft
Est. Value
About This Home
This home is located at 389 Lokeys Ridge Rd Unit 43A, Bethlehem, GA 30620 and is currently estimated at $341,321, approximately $181 per square foot. 389 Lokeys Ridge Rd Unit 43A is a home located in Barrow County with nearby schools including Yargo Elementary School, Haymon-Morris Middle School, and Apalachee High School.
Ownership History
Date
Name
Owned For
Owner Type
Purchase Details
Closed on
Apr 8, 2016
Sold by
Adams Lisa A
Bought by
Main Shane A
Current Estimated Value
Home Financials for this Owner
Home Financials are based on the most recent Mortgage that was taken out on this home.
Original Mortgage
$107,025
Outstanding Balance
$87,239
Interest Rate
4.5%
Mortgage Type
FHA
Estimated Equity
$254,082
Purchase Details
Closed on
Nov 21, 2001
Sold by
Star Home Builders
Bought by
Adams Lisa A
Home Financials for this Owner
Home Financials are based on the most recent Mortgage that was taken out on this home.
Original Mortgage
$127,468
Interest Rate
6.6%
Mortgage Type
New Conventional
Purchase Details
Closed on
Aug 3, 2001
Sold by
Parkview Development
Bought by
Star Home Builders I
Purchase Details
Closed on
Feb 3, 2000
Bought by
Parkview Development
Create a Home Valuation Report for This Property
The Home Valuation Report is an in-depth analysis detailing your home's value as well as a comparison with similar homes in the area
Home Values in the Area
Average Home Value in this Area
Purchase History
| Date | Buyer | Sale Price | Title Company |
|---|---|---|---|
| Main Shane A | $109,000 | -- | |
| Addison Lisa A | -- | -- | |
| Adams Lisa A | $124,900 | -- | |
| Star Home Builders I | $28,000 | -- | |
| Parkview Development | -- | -- |
Source: Public Records
Mortgage History
| Date | Status | Borrower | Loan Amount |
|---|---|---|---|
| Open | Addison Lisa A | $107,025 | |
| Closed | Main Shane A | $107,025 | |
| Previous Owner | Adams Lisa A | $127,468 |
Source: Public Records
Tax History Compared to Growth
Tax History
| Year | Tax Paid | Tax Assessment Tax Assessment Total Assessment is a certain percentage of the fair market value that is determined by local assessors to be the total taxable value of land and additions on the property. | Land | Improvement |
|---|---|---|---|---|
| 2024 | $3,032 | $120,339 | $25,200 | $95,139 |
| 2023 | $3,032 | $120,739 | $25,200 | $95,539 |
| 2022 | $2,564 | $87,320 | $20,000 | $67,320 |
| 2021 | $2,391 | $76,628 | $16,000 | $60,628 |
| 2020 | $2,130 | $67,706 | $16,000 | $51,706 |
| 2019 | $2,167 | $67,706 | $16,000 | $51,706 |
| 2018 | $2,059 | $64,906 | $13,200 | $51,706 |
| 2017 | $1,606 | $55,172 | $13,200 | $41,972 |
| 2016 | $1,408 | $48,244 | $13,200 | $35,044 |
| 2015 | $1,414 | $48,244 | $13,200 | $35,044 |
| 2014 | $1,233 | $41,906 | $6,468 | $35,438 |
| 2013 | -- | $39,676 | $6,468 | $33,208 |
Source: Public Records
Map
Nearby Homes
- 303 Ron Dr
- 209 Angie Way
- 0 Jb Owens Unit 7552902
- 0 Jb Owens Unit 7552891
- 0 Jb Owens Unit LOT 2 - 2.09 ACRES
- 0 Jb Owens Unit LOT 3 - 2.01 ACRES
- 758 Clarence Edwards Rd
- 1129 Loganville Hwy
- 190 Lokeys Ln
- 1111 Otis Dr
- 1024 Lyndhurst Ln
- The Barnes Plan at River Meadows
- The Paisley Plan at River Meadows
- The Rose II Plan at River Meadows
- The Logan Plan at River Meadows
- 637 Sleeping Meadow Ln
- 0 Tanners Bridge Rd Unit 10588144
- 1164 Otis Dr
- 286 Meadows Dr
- 763 Moss Side Dr
- 389 Lokeys Ridge Rd
- 391 Lokeys Ridge Rd Unit 44A
- 391 Lokeys Ridge Rd
- 387 Lokeys Ridge Rd
- 391 Lokey's Ridge Rd
- 385 Lokeys Ridge Rd
- 393 Lokeys Ridge Rd
- 390 Lokeys Ridge Rd
- 3606 Shoal Dr
- J B Owens Rd
- 388 Lokey's Ridge Rd
- 383 Lokeys Ridge Rd
- 395 Lokeys Ridge Rd
- 392 Lokeys Ridge Rd
- 388 Lokeys Ridge Rd
- 386 Lokeys Ridge Rd
- 384 Lokeys Ridge Rd Unit 35B
- 384 Lokeys Ridge Rd Unit 1
- 397 Lokeys Ridge Rd
- 381 Lokeys Ridge Rd