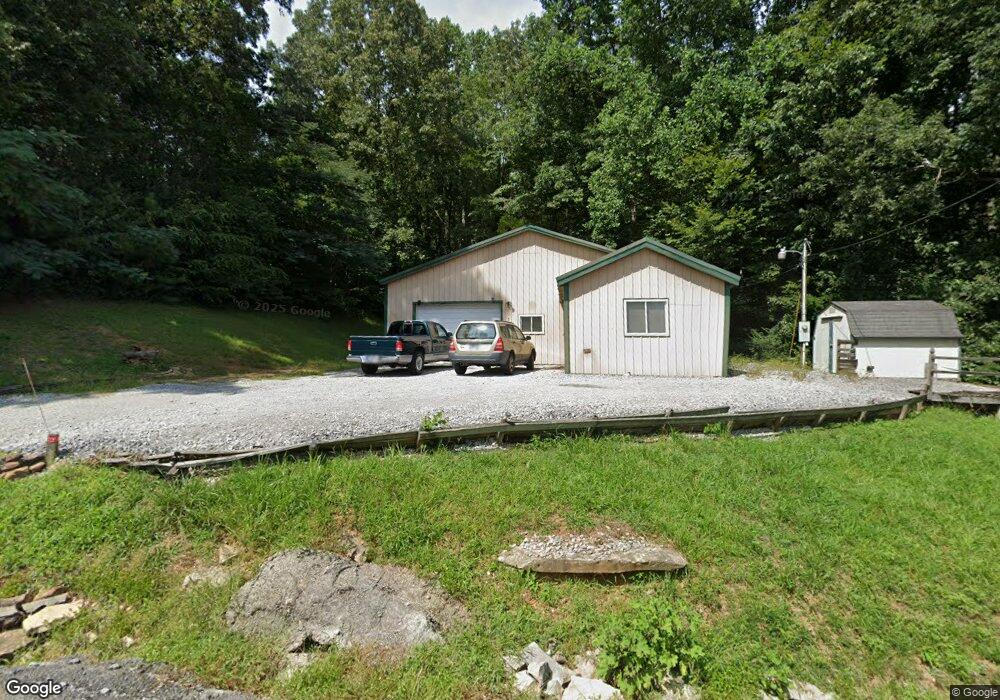
389 Luckey Ln Sparta, TN 38583
Estimated Value: $135,000 - $349,000
1
Bed
1
Bath
240
Sq Ft
$879/Sq Ft
Est. Value
About This Home
This home is located at 389 Luckey Ln, Sparta, TN 38583 and is currently estimated at $211,022, approximately $879 per square foot. 389 Luckey Ln is a home located in White County with nearby schools including Woodland Park Elementary School, White County Middle School, and White County High School.
Ownership History
Date
Name
Owned For
Owner Type
Purchase Details
Closed on
Jul 11, 2019
Sold by
Durall Jack L and Durall Linda
Bought by
Smith Linda and Schuman Mary
Current Estimated Value
Purchase Details
Closed on
Jan 10, 2008
Sold by
Lashay Judd Whitney
Bought by
Durall Jack L
Purchase Details
Closed on
Jan 4, 2005
Sold by
Denise Mcbride Paula
Bought by
Durall Jack L
Purchase Details
Closed on
Oct 27, 2004
Bought by
Durall Jack L and Whitney Lashay Judd
Purchase Details
Closed on
May 30, 1997
Sold by
Judd John W
Bought by
Richardson Paula D
Purchase Details
Closed on
Feb 7, 1997
Bought by
Richardson Paula Denise and Whitney Lashay Judd
Purchase Details
Closed on
Aug 10, 1993
Bought by
Judd John W
Purchase Details
Closed on
Feb 17, 1989
Bought by
Judd John W
Purchase Details
Closed on
Oct 2, 1987
Bought by
Halfacre Audie R and Halfacre Virginia R
Purchase Details
Closed on
Jan 1, 1987
Create a Home Valuation Report for This Property
The Home Valuation Report is an in-depth analysis detailing your home's value as well as a comparison with similar homes in the area
Home Values in the Area
Average Home Value in this Area
Purchase History
| Date | Buyer | Sale Price | Title Company |
|---|---|---|---|
| Smith Linda | $60,000 | None Available | |
| Durall Jack L | $500 | -- | |
| Durall Jack L | $3,500 | -- | |
| Durall Jack L | $3,500 | -- | |
| Richardson Paula D | $5,000 | -- | |
| Richardson Paula Denise | $5,000 | -- | |
| Judd John W | -- | -- | |
| Judd John W | $6,000 | -- | |
| Halfacre Audie R | -- | -- | |
| -- | $2,000 | -- |
Source: Public Records
Tax History Compared to Growth
Tax History
| Year | Tax Paid | Tax Assessment Tax Assessment Total Assessment is a certain percentage of the fair market value that is determined by local assessors to be the total taxable value of land and additions on the property. | Land | Improvement |
|---|---|---|---|---|
| 2025 | $328 | $25,200 | $0 | $0 |
| 2024 | $328 | $16,000 | $3,750 | $12,250 |
| 2023 | $328 | $16,000 | $3,750 | $12,250 |
| 2022 | $328 | $16,000 | $3,750 | $12,250 |
| 2021 | $328 | $16,000 | $3,750 | $12,250 |
| 2020 | $328 | $16,000 | $3,750 | $12,250 |
| 2019 | $378 | $18,425 | $3,000 | $15,425 |
| 2018 | $378 | $18,425 | $3,000 | $15,425 |
| 2017 | $378 | $18,425 | $3,000 | $15,425 |
| 2016 | $378 | $18,425 | $3,000 | $15,425 |
| 2015 | $341 | $18,425 | $3,000 | $15,425 |
| 2014 | -- | $18,425 | $3,000 | $15,425 |
| 2013 | -- | $16,050 | $2,725 | $13,325 |
Source: Public Records
Map
Nearby Homes
- 77 River Front Dr
- 179 River Front Dr
- 253 River Front Dr
- 263 River Oaks Dr
- 70 River Oaks Dr
- 88 River Oaks Dr
- 523 Doctor I C Morgan Rd
- 459 Doctor I C Morgan Rd
- 257 Earls Ln
- 1.85 AC Cane Creek-Cummingsville Rd
- 185 Cane Creek-Cummingsville Rd
- 431 Bald Knob Mtn & Cummings Cove Rd
- 2359 E Gooseneck Rd
- 1781 Hodges Bridge Rd
- 138 Falls View Rd
- 172 Black Horse Trail
- 177 Hidden River Ave
- 0 Hidden River Ave Unit 1323479
- 362 Saddlebrook Dr
- 0 Cane Creek-Cummingsville Rd
- 297 Luckey Ln
- 380 Luckey Ln
- 400 Luckey Ln
- 360 Luckey Ln
- 432 Luckey Ln
- 440 Luckey Ln
- 320 Luckey Ln
- 217 Luckey Ln
- 458 Luckey Ln
- 511 Luckey Ln
- 284 Luckey Ln
- 0 Luckey Ln
- 9.7 AC Luckey Ln
- Lot 16 Luckey Ln
- Lot 35 Luckey Ln
- 195 Luckey Ln
- 115 River Front Dr
- 115 115 River Front Dr
- 550 Luckey Ln
- 575 Luckey Ln