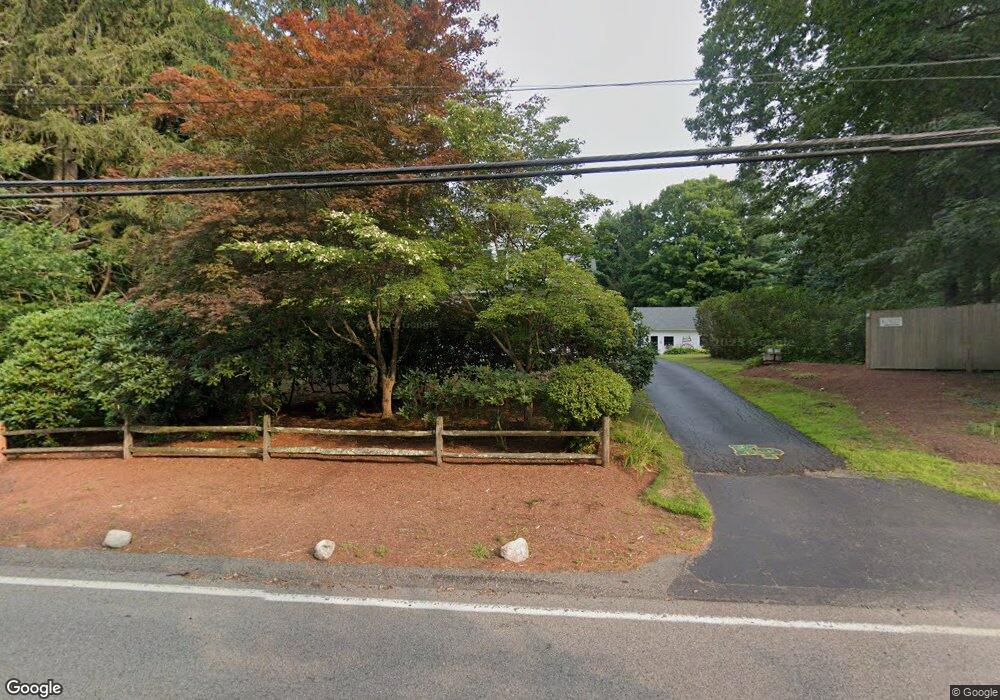
389 Main St Norfolk, MA 02056
Estimated Value: $742,748 - $873,000
3
Beds
2
Baths
2,450
Sq Ft
$336/Sq Ft
Est. Value
About This Home
This home is located at 389 Main St, Norfolk, MA 02056 and is currently estimated at $823,687, approximately $336 per square foot. 389 Main St is a home located in Norfolk County with nearby schools including H. Olive Day School, Freeman-Kennedy School, and Woodside Montessori Academy.
Ownership History
Date
Name
Owned For
Owner Type
Purchase Details
Closed on
Aug 23, 2000
Sold by
Merritt Margaret V
Bought by
Mccarthy Daniel L and Mccarthy Amanda M
Current Estimated Value
Home Financials for this Owner
Home Financials are based on the most recent Mortgage that was taken out on this home.
Original Mortgage
$194,000
Outstanding Balance
$69,548
Interest Rate
8.06%
Mortgage Type
Purchase Money Mortgage
Estimated Equity
$754,139
Create a Home Valuation Report for This Property
The Home Valuation Report is an in-depth analysis detailing your home's value as well as a comparison with similar homes in the area
Home Values in the Area
Average Home Value in this Area
Purchase History
| Date | Buyer | Sale Price | Title Company |
|---|---|---|---|
| Mccarthy Daniel L | $243,000 | -- |
Source: Public Records
Mortgage History
| Date | Status | Borrower | Loan Amount |
|---|---|---|---|
| Open | Mccarthy Daniel L | $194,000 | |
| Previous Owner | Mccarthy Daniel L | $42,000 |
Source: Public Records
Tax History Compared to Growth
Tax History
| Year | Tax Paid | Tax Assessment Tax Assessment Total Assessment is a certain percentage of the fair market value that is determined by local assessors to be the total taxable value of land and additions on the property. | Land | Improvement |
|---|---|---|---|---|
| 2025 | $9,424 | $590,100 | $229,500 | $360,600 |
| 2024 | $8,274 | $531,400 | $242,800 | $288,600 |
| 2023 | $8,249 | $502,700 | $231,600 | $271,100 |
| 2022 | $7,790 | $428,000 | $214,400 | $213,600 |
| 2021 | $7,930 | $440,800 | $188,800 | $252,000 |
| 2020 | $7,372 | $395,500 | $180,400 | $215,100 |
| 2019 | $7,075 | $386,800 | $180,400 | $206,400 |
| 2018 | $6,547 | $351,600 | $166,000 | $185,600 |
| 2017 | $6,457 | $354,400 | $166,000 | $188,400 |
| 2016 | $5,975 | $330,500 | $162,500 | $168,000 |
| 2015 | $5,655 | $320,200 | $154,800 | $165,400 |
| 2014 | $5,626 | $322,800 | $154,800 | $168,000 |
Source: Public Records
Map
Nearby Homes
- 11 Waites Crossing
- 20 Waites Crossing
- 19 Waites Crossing
- 9 Waites Crossing
- 13 Waites Crossing
- 33 Daniels St
- 41 Myrtle St
- 0 Toils End Rd
- 11 Elliot Mills Unit 6
- 12 Waites Crossing Way
- 292 Main St
- 70 Daniels St
- 324 Pleasant St
- 14 Essex St
- 10 Silver Fox Rd
- 99 Leland Rd
- 12 Ariana Ln
- 266 Pleasant St
- 312 Eagles Nest Way Unit 312
- 10 Populatic Street Extension