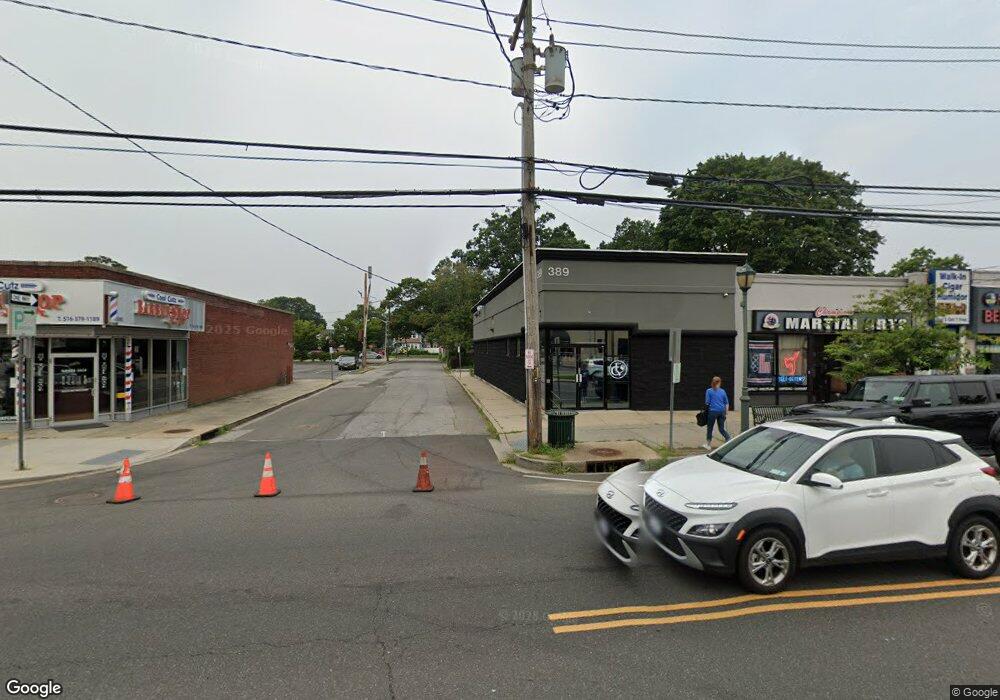
389 Merrick Ave Unit A North Merrick, NY 11566
Estimated Value: $1,184,865
--
Bed
--
Bath
4,862
Sq Ft
$244/Sq Ft
Est. Value
About This Home
This home is located at 389 Merrick Ave Unit A, North Merrick, NY 11566 and is currently estimated at $1,184,865, approximately $243 per square foot. 389 Merrick Ave Unit A is a home located in Nassau County with nearby schools including Merrick Avenue Middle School, Sanford H Calhoun High School, and Sacred Heart School.
Ownership History
Date
Name
Owned For
Owner Type
Purchase Details
Closed on
Dec 5, 2024
Sold by
Grohwell Llc
Bought by
Cfy Proeprties Llc
Current Estimated Value
Home Financials for this Owner
Home Financials are based on the most recent Mortgage that was taken out on this home.
Original Mortgage
$843,750
Outstanding Balance
$835,159
Interest Rate
6%
Mortgage Type
Stand Alone First
Estimated Equity
$349,706
Purchase Details
Closed on
Nov 16, 2004
Sold by
Takhalov Alexander
Bought by
Grohwell Llc
Purchase Details
Closed on
Jun 10, 1996
Sold by
Puglisi Victor
Bought by
Takhalov Alexander
Home Financials for this Owner
Home Financials are based on the most recent Mortgage that was taken out on this home.
Original Mortgage
$50,000
Interest Rate
7.97%
Mortgage Type
Commercial
Create a Home Valuation Report for This Property
The Home Valuation Report is an in-depth analysis detailing your home's value as well as a comparison with similar homes in the area
Home Values in the Area
Average Home Value in this Area
Purchase History
| Date | Buyer | Sale Price | Title Company |
|---|---|---|---|
| Cfy Proeprties Llc | $1,125,000 | Chicago Title Insurance Co | |
| Cfy Proeprties Llc | $1,125,000 | Chicago Title Insurance Co | |
| Cfy Proeprties Llc | $1,125,000 | Chicago Title Insurance Co | |
| Grohwell Llc | $165,000 | -- | |
| Grohwell Llc | $165,000 | -- | |
| Takhalov Alexander | $50,000 | -- | |
| Takhalov Alexander | $50,000 | -- |
Source: Public Records
Mortgage History
| Date | Status | Borrower | Loan Amount |
|---|---|---|---|
| Open | Cfy Proeprties Llc | $843,750 | |
| Closed | Cfy Proeprties Llc | $843,750 | |
| Previous Owner | Takhalov Alexander | $50,000 |
Source: Public Records
Tax History Compared to Growth
Tax History
| Year | Tax Paid | Tax Assessment Tax Assessment Total Assessment is a certain percentage of the fair market value that is determined by local assessors to be the total taxable value of land and additions on the property. | Land | Improvement |
|---|---|---|---|---|
| 2025 | $26,689 | $4,067 | $788 | $3,279 |
| 2024 | $10,968 | $4,067 | $788 | $3,279 |
| 2023 | $24,576 | $4,067 | $788 | $3,279 |
| 2022 | $24,576 | $4,067 | $788 | $3,279 |
| 2021 | $30,304 | $4,278 | $788 | $3,490 |
| 2020 | $24,471 | $3,193 | $964 | $2,229 |
| 2019 | $25,688 | $3,193 | $964 | $2,229 |
| 2018 | $24,332 | $3,193 | $0 | $0 |
| 2017 | $12,478 | $3,193 | $964 | $2,229 |
| 2016 | $23,634 | $3,193 | $964 | $2,229 |
| 2015 | $9,362 | $3,193 | $964 | $2,229 |
| 2014 | $9,362 | $3,193 | $964 | $2,229 |
| 2013 | $8,680 | $3,193 | $964 | $2,229 |
Source: Public Records
Map
Nearby Homes
- 12 Washington Dr
- 2 Garfield St
- 1741 Pettit Ave
- 1910 Adair Place
- 1800 Remson Ave
- 42 E Webster St
- 1580 Little Whaleneck Rd
- 2005 Abbot Ave
- 19 Margaret Blvd
- 1772 Rose St
- 1824 Gildersleeve St
- 1818 Gormley Ave
- 96 Thelma Ave
- 2282 Sycamore Place
- 70 Nancy Blvd
- 208 Camp Ave
- 1707 Carroll Ave
- 1804 Leona Ct
- 1729 Gormley Ave
- 1931 Miller Place
- 389 Merrick Ave Unit B
- 393 Merrick Ave
- 395 Merrick Ave
- 3 Johnson St
- 397 Merrick Ave N
- 379 Merrick Ave
- 373 Merrick Ave
- 361 Merrick Ave
- 7 Johnson St
- 1717a Merrick Ave
- 11 Camp Ave
- 1721 Merrick Ave
- 1721 Merrick Ave Unit A
- 1717 Merrick Ave
- 2000 Camp Ave
- 1745 Merrick Ave
- 2001 Garfield St
- 1723 Washington Dr
- 15 Washington Dr
- 1994 Camp Ave