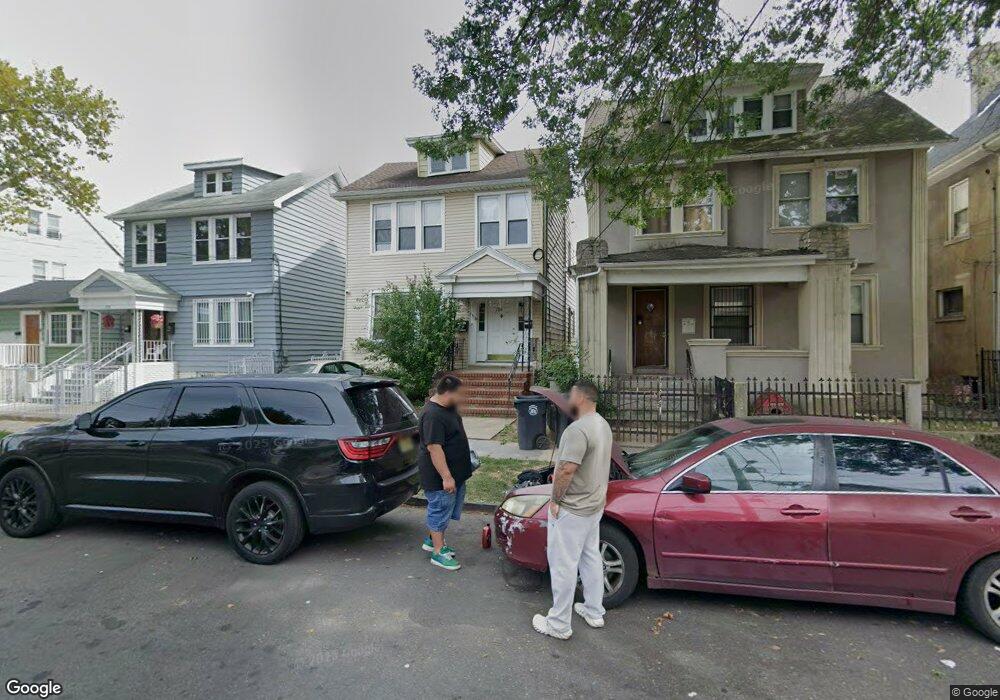
389 N 7th St Newark, NJ 07107
Lower Roseville NeighborhoodEstimated Value: $565,795 - $745,000
--
Bed
--
Bath
2,552
Sq Ft
$264/Sq Ft
Est. Value
About This Home
This home is located at 389 N 7th St, Newark, NJ 07107 and is currently estimated at $673,699, approximately $263 per square foot. 389 N 7th St is a home located in Essex County with nearby schools including Dr. William H. Horton School, First Avenue Elementary School, and Franklin School.
Ownership History
Date
Name
Owned For
Owner Type
Purchase Details
Closed on
Oct 21, 2009
Sold by
Roman Nelson and Cepeda Antonio
Bought by
Cepeda Ricardo
Current Estimated Value
Purchase Details
Closed on
Oct 10, 2003
Sold by
Genao Luis
Bought by
Roman Nelson and Cepeda Antonia
Home Financials for this Owner
Home Financials are based on the most recent Mortgage that was taken out on this home.
Original Mortgage
$282,000
Outstanding Balance
$131,056
Interest Rate
6.15%
Estimated Equity
$542,643
Purchase Details
Closed on
Jun 25, 2003
Sold by
Firas Jose
Bought by
Genao Luis
Home Financials for this Owner
Home Financials are based on the most recent Mortgage that was taken out on this home.
Original Mortgage
$261,250
Interest Rate
5.53%
Purchase Details
Closed on
May 17, 2001
Sold by
Aseencio Cecilia
Bought by
Frias Jose and Frias Jasmine Arias
Home Financials for this Owner
Home Financials are based on the most recent Mortgage that was taken out on this home.
Original Mortgage
$139,500
Interest Rate
7.03%
Create a Home Valuation Report for This Property
The Home Valuation Report is an in-depth analysis detailing your home's value as well as a comparison with similar homes in the area
Home Values in the Area
Average Home Value in this Area
Purchase History
| Date | Buyer | Sale Price | Title Company |
|---|---|---|---|
| Cepeda Ricardo | -- | None Available | |
| Roman Nelson | $282,000 | -- | |
| Genao Luis | $275,000 | -- | |
| Frias Jose | $156,000 | -- |
Source: Public Records
Mortgage History
| Date | Status | Borrower | Loan Amount |
|---|---|---|---|
| Open | Roman Nelson | $282,000 | |
| Previous Owner | Genao Luis | $261,250 | |
| Previous Owner | Frias Jose | $139,500 |
Source: Public Records
Tax History Compared to Growth
Tax History
| Year | Tax Paid | Tax Assessment Tax Assessment Total Assessment is a certain percentage of the fair market value that is determined by local assessors to be the total taxable value of land and additions on the property. | Land | Improvement |
|---|---|---|---|---|
| 2025 | $8,813 | $236,400 | $28,800 | $207,600 |
| 2024 | $8,813 | $236,400 | $28,800 | $207,600 |
| 2022 | $8,832 | $236,400 | $28,800 | $207,600 |
| 2021 | $7,520 | $201,400 | $28,800 | $172,600 |
| 2020 | $5,943 | $156,400 | $28,800 | $127,600 |
| 2019 | $5,882 | $156,400 | $28,800 | $127,600 |
| 2018 | $5,776 | $156,400 | $28,800 | $127,600 |
| 2017 | $5,568 | $156,400 | $28,800 | $127,600 |
| 2016 | $5,380 | $156,400 | $28,800 | $127,600 |
| 2015 | $5,175 | $156,400 | $28,800 | $127,600 |
| 2014 | $4,850 | $156,400 | $28,800 | $127,600 |
Source: Public Records
Map
Nearby Homes
- 382-384 N 7th St
- 372 N 7th St
- 352 N 7th St
- 362 N 6th St
- 323 N 7th St
- 318 N 7th St
- 349 N 5th St
- 347 N 5th St Unit 349
- 457 N 7th St
- 226 N 9th St
- 166 N 9th St Unit 3
- 277 2nd Ave W Unit 2
- 277 2nd Ave W
- 504 N 7th St Unit 506
- 504-506 N 7th St
- 248 N 7th St Unit 248
- 118 N 9th St Unit 120
- 118-120 N 9th St
- 261 Lake St
- 126 Highland Ave
- 391 N 7th St
- 387 N 7th St
- 395 N 7th St Unit 397
- 395 N 7th St Unit 1
- 399 N 7th St Unit 401
- 385 N 7th St
- 414 N 6th St
- 412 N 6th St
- 416 N 6th St
- 410 N 6th St
- 383 N 7th St
- 418 N 6th St
- 408 N 6th St
- 403 N 7th St Unit 405
- 420 N 6th St
- 379 N 7th St Unit 381
- 406 N 6th St
- 379-381 N 7th St
- 390 N 7th St
- 392-394 N 7th St