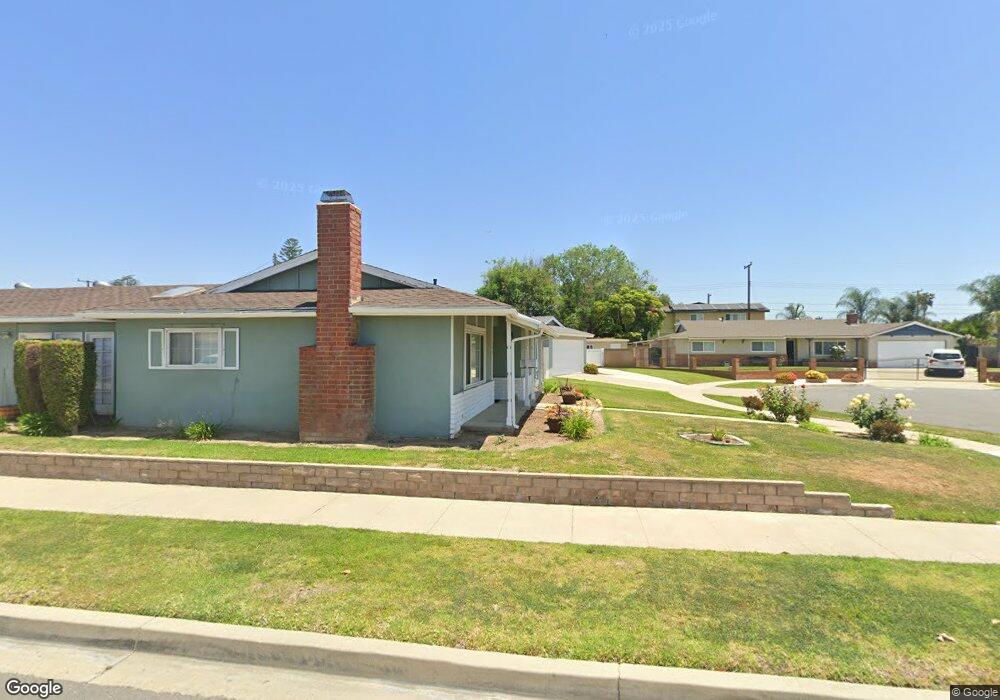
389 N Clinton St Orange, CA 92867
Estimated Value: $1,010,000 - $1,339,000
4
Beds
2
Baths
1,520
Sq Ft
$733/Sq Ft
Est. Value
About This Home
This home is located at 389 N Clinton St, Orange, CA 92867 and is currently estimated at $1,113,855, approximately $732 per square foot. 389 N Clinton St is a home located in Orange County with nearby schools including Handy Elementary School, Yorba Middle School, and Orange High School.
Ownership History
Date
Name
Owned For
Owner Type
Purchase Details
Closed on
Jan 24, 2021
Sold by
Hensley Timothy J and Hensley Kimberly A
Bought by
Hensley Timothy J and Hensley Kimberly A
Current Estimated Value
Home Financials for this Owner
Home Financials are based on the most recent Mortgage that was taken out on this home.
Original Mortgage
$393,100
Outstanding Balance
$350,974
Interest Rate
2.6%
Mortgage Type
New Conventional
Estimated Equity
$762,881
Purchase Details
Closed on
May 4, 2020
Sold by
Hensley Timothy J and Hensley Kimberly A
Bought by
Hensley Timothy J and Hensley Kimberly A
Home Financials for this Owner
Home Financials are based on the most recent Mortgage that was taken out on this home.
Original Mortgage
$400,000
Interest Rate
3.3%
Mortgage Type
New Conventional
Purchase Details
Closed on
Sep 27, 2019
Sold by
Hensley Timothy J and Hensley Kimberly A
Bought by
Hensley Timothy J and Hensley Kimberly A
Home Financials for this Owner
Home Financials are based on the most recent Mortgage that was taken out on this home.
Original Mortgage
$390,000
Interest Rate
3.5%
Mortgage Type
New Conventional
Purchase Details
Closed on
Jul 7, 2017
Sold by
Hensley Timothy and Hensley Kimberly
Bought by
Hensley Timothy J and Hensley Kimberly A
Home Financials for this Owner
Home Financials are based on the most recent Mortgage that was taken out on this home.
Original Mortgage
$410,000
Interest Rate
3.9%
Mortgage Type
New Conventional
Purchase Details
Closed on
Feb 24, 2006
Sold by
Hensley Timothy J and Hensley Kimberly A
Bought by
Hensley Timothy J and Hensley Kimberly A
Home Financials for this Owner
Home Financials are based on the most recent Mortgage that was taken out on this home.
Original Mortgage
$65,000
Interest Rate
6.19%
Mortgage Type
New Conventional
Purchase Details
Closed on
Sep 2, 2004
Sold by
Hensley Timothy James and Hensley Kimberly Anne
Bought by
Hensley Timothy J and Hensley Kimberly A
Purchase Details
Closed on
Jul 3, 2003
Sold by
Bergum Gary E
Bought by
Hensley Timothy James and Hensley Kimberly Anne
Home Financials for this Owner
Home Financials are based on the most recent Mortgage that was taken out on this home.
Original Mortgage
$316,000
Interest Rate
5.29%
Mortgage Type
Purchase Money Mortgage
Purchase Details
Closed on
Jan 30, 2003
Sold by
Bergum Shelia R
Bought by
Bergum Gary E
Create a Home Valuation Report for This Property
The Home Valuation Report is an in-depth analysis detailing your home's value as well as a comparison with similar homes in the area
Home Values in the Area
Average Home Value in this Area
Purchase History
| Date | Buyer | Sale Price | Title Company |
|---|---|---|---|
| Hensley Timothy J | -- | Stewart Title Of Ca Inc | |
| Hensley Timothy J | -- | Accommodation | |
| Hensley Timothy J | -- | Stewart Title Of Ca Inc | |
| Hensley Timothy J | -- | Stewart Title Of Ca Inc | |
| Hensley Timothy J | -- | Accommodation | |
| Hensley Timothy S | -- | Stewart Title | |
| Hensley Timothy J | -- | None Available | |
| Hensley Timothy | -- | Title365 | |
| Hensley Timothy J | -- | First American Title Ins | |
| Hensley Timothy J | -- | First American Title Ins | |
| Hensley Timothy J | -- | -- | |
| Hensley Timothy James | $395,000 | United Title Company | |
| Bergum Gary E | -- | Chicago Title Co | |
| Bergum Gary E | -- | Chicago Title Co |
Source: Public Records
Mortgage History
| Date | Status | Borrower | Loan Amount |
|---|---|---|---|
| Open | Hensley Timothy J | $393,100 | |
| Closed | Hensley Timothy J | $400,000 | |
| Closed | Hensley Timothy S | $390,000 | |
| Closed | Hensley Timothy | $410,000 | |
| Closed | Hensley Timothy J | $65,000 | |
| Closed | Hensley Timothy James | $316,000 |
Source: Public Records
Tax History Compared to Growth
Tax History
| Year | Tax Paid | Tax Assessment Tax Assessment Total Assessment is a certain percentage of the fair market value that is determined by local assessors to be the total taxable value of land and additions on the property. | Land | Improvement |
|---|---|---|---|---|
| 2025 | $6,140 | $561,601 | $469,440 | $92,161 |
| 2024 | $6,140 | $550,590 | $460,236 | $90,354 |
| 2023 | $6,002 | $539,795 | $451,212 | $88,583 |
| 2022 | $5,884 | $529,211 | $442,364 | $86,847 |
| 2021 | $5,719 | $518,835 | $433,690 | $85,145 |
| 2020 | $5,666 | $513,515 | $429,243 | $84,272 |
| 2019 | $5,594 | $503,447 | $420,827 | $82,620 |
| 2018 | $5,508 | $493,576 | $412,576 | $81,000 |
| 2017 | $5,279 | $483,899 | $404,487 | $79,412 |
| 2016 | $5,176 | $474,411 | $396,556 | $77,855 |
| 2015 | $5,100 | $467,285 | $390,599 | $76,686 |
| 2014 | $4,772 | $437,000 | $366,830 | $70,170 |
Source: Public Records
Map
Nearby Homes
- 2515 E Orange Grove Ave
- 234 N Milford St
- 2705 E Orange Grove Ave
- 641 N Milford St
- 415 N Wayfield St
- 1904 E Palm Ave
- 2929 E Hamilton Ave
- 3145 E Scotts View Unit A
- 692 N Adele St Unit 30
- 692 N Adele St Unit 103
- 692 N Adele St Unit 109
- 692 N Adele St Unit 78
- 790 N Fern St
- 811 N Handy St
- 129 S Kathleen Ln
- 3318 E Chardonnay Ln Unit B
- 448 N Londonderry Ln Unit D
- 316 N Shattuck Place
- 1514 E Palm Ave
- 308 S Craig Dr
- 393 N Clinton St
- 377 N Clinton St
- 407 N Clinton St
- 386 N Handy St
- 403 N Clinton St
- 394 N Handy St
- 378 N Handy St
- 402 N Handy St
- 367 N Clinton St
- 368 N Handy St
- 415 N Clinton St
- 412 N Handy St
- 363 N Clinton St
- 358 N Handy St
- 394 N Clinton St
- 384 N Clinton St
- 402 N Clinton St
- 422 N Handy St
- 374 N Clinton St
- 425 N Clinton St