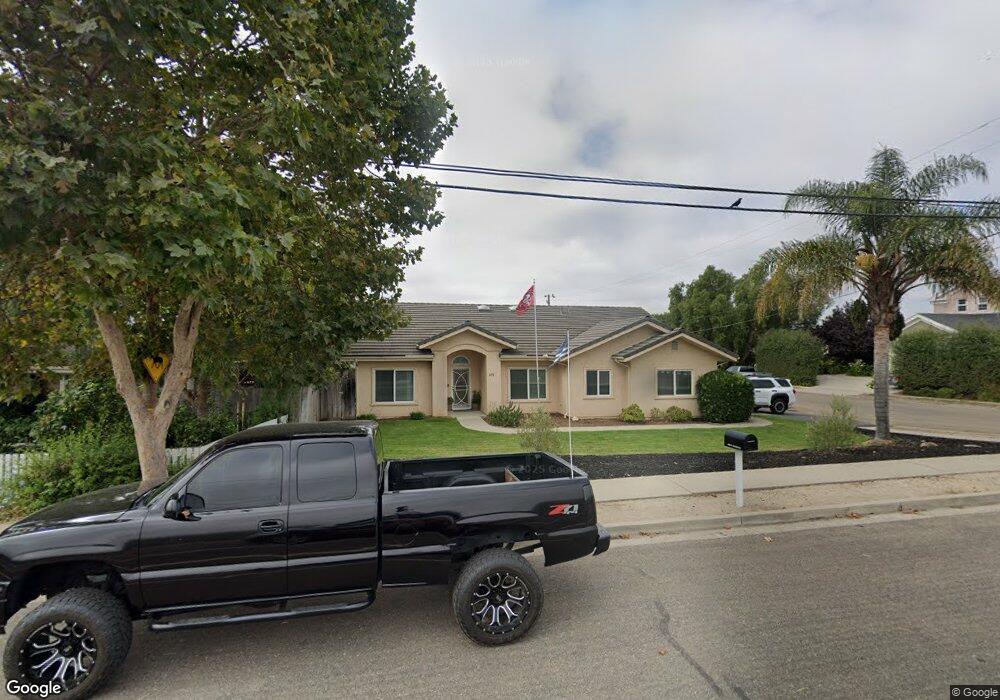
389 N Thompson Ave Nipomo, CA 93444
Estimated Value: $791,130 - $956,000
3
Beds
2
Baths
1,926
Sq Ft
$443/Sq Ft
Est. Value
About This Home
This home is located at 389 N Thompson Ave, Nipomo, CA 93444 and is currently estimated at $852,283, approximately $442 per square foot. 389 N Thompson Ave is a home located in San Luis Obispo County with nearby schools including Nipomo Elementary School, Mesa Middle School, and Nipomo High School.
Ownership History
Date
Name
Owned For
Owner Type
Purchase Details
Closed on
Jun 29, 2021
Sold by
Chanley Christine Marie and Smith Roxanne Fay
Bought by
Crockett Justin and Dias Teri Lynn
Current Estimated Value
Home Financials for this Owner
Home Financials are based on the most recent Mortgage that was taken out on this home.
Original Mortgage
$576,000
Outstanding Balance
$522,631
Interest Rate
2.9%
Mortgage Type
New Conventional
Estimated Equity
$329,652
Purchase Details
Closed on
Sep 2, 2017
Sold by
Chanley Christine Marie and Smith Roxanne Fay
Bought by
Chanley Christine Marie and Christine Marie Chanley 2017 T
Purchase Details
Closed on
Apr 26, 2003
Sold by
Stokes Scott Jm and Stokes Jennifer J
Bought by
Chanley Christine M
Home Financials for this Owner
Home Financials are based on the most recent Mortgage that was taken out on this home.
Original Mortgage
$199,000
Interest Rate
5.84%
Mortgage Type
Stand Alone First
Purchase Details
Closed on
Jul 11, 2002
Sold by
Leach Laurence L
Bought by
Stokes Scott Jm and Stokes Jennifer J
Home Financials for this Owner
Home Financials are based on the most recent Mortgage that was taken out on this home.
Original Mortgage
$139,920
Interest Rate
6.52%
Create a Home Valuation Report for This Property
The Home Valuation Report is an in-depth analysis detailing your home's value as well as a comparison with similar homes in the area
Home Values in the Area
Average Home Value in this Area
Purchase History
| Date | Buyer | Sale Price | Title Company |
|---|---|---|---|
| Crockett Justin | $640,000 | Chicago Title Company | |
| Chanley Christine Marie | -- | None Available | |
| Chanley Christine Marie | -- | None Available | |
| Chanley Christine M | $386,000 | Chicago Title Company | |
| Stokes Scott Jm | $180,000 | Chicago Title Co |
Source: Public Records
Mortgage History
| Date | Status | Borrower | Loan Amount |
|---|---|---|---|
| Open | Crockett Justin | $576,000 | |
| Previous Owner | Chanley Christine M | $199,000 | |
| Previous Owner | Stokes Scott Jm | $139,920 |
Source: Public Records
Tax History
| Year | Tax Paid | Tax Assessment Tax Assessment Total Assessment is a certain percentage of the fair market value that is determined by local assessors to be the total taxable value of land and additions on the property. | Land | Improvement |
|---|---|---|---|---|
| 2025 | $6,986 | $679,173 | $265,302 | $413,871 |
| 2024 | $6,906 | $665,856 | $260,100 | $405,756 |
| 2023 | $6,906 | $652,800 | $255,000 | $397,800 |
| 2022 | $6,802 | $640,000 | $250,000 | $390,000 |
| 2021 | $5,526 | $510,679 | $200,697 | $309,982 |
| 2020 | $5,463 | $505,444 | $198,640 | $306,804 |
| 2019 | $5,429 | $495,535 | $194,746 | $300,789 |
| 2018 | $5,364 | $485,820 | $190,928 | $294,892 |
| 2017 | $5,264 | $476,295 | $187,185 | $289,110 |
| 2016 | $4,965 | $466,957 | $183,515 | $283,442 |
| 2015 | $4,564 | $429,000 | $170,000 | $259,000 |
| 2014 | $4,337 | $415,000 | $165,000 | $250,000 |
Source: Public Records
Map
Nearby Homes
- 124 W Chestnut St
- 150 E Chestnut St
- 195 E Chestnut St
- 1 W Branch St
- 240 Dahlia St
- 183 E Tefft St
- 189 E Tefft St
- 239 E Branch St
- 195 E Tefft St
- 247 E Branch St
- 267 W Tefft St
- 285 E Tefft St
- 0 S Burton St
- 90111003 W Price St
- 136 Clearwater Ln
- 100 E Bennett St
- 160 San Antonio Ln
- 449 W Tefft St
- 449 W Tefft St Unit 23
- 449 W Tefft St Unit 13
Your Personal Tour Guide
Ask me questions while you tour the home.