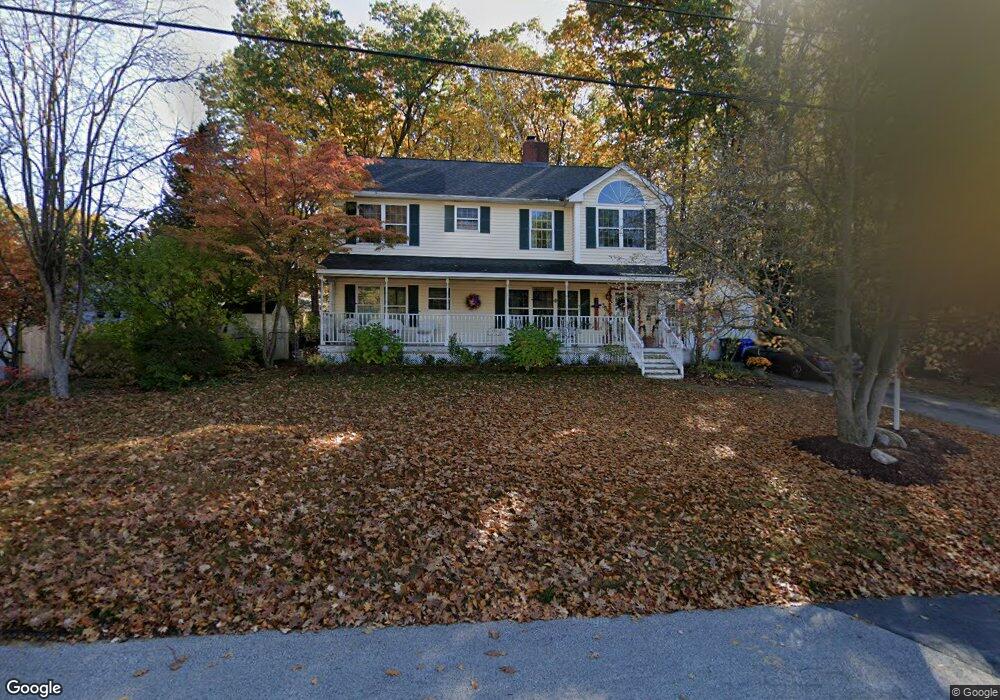
389 Tory Rd Manchester, NH 03104
Straw-Smyth NeighborhoodEstimated Value: $527,000 - $594,000
4
Beds
2
Baths
2,100
Sq Ft
$267/Sq Ft
Est. Value
About This Home
This home is located at 389 Tory Rd, Manchester, NH 03104 and is currently estimated at $561,470, approximately $267 per square foot. 389 Tory Rd is a home located in Hillsborough County with nearby schools including Smyth Road School, Hillside Middle School, and Manchester Central High School.
Ownership History
Date
Name
Owned For
Owner Type
Purchase Details
Closed on
Apr 26, 1999
Sold by
Demetriou Ellie
Bought by
Brown Michael A and Brown Angela D
Current Estimated Value
Home Financials for this Owner
Home Financials are based on the most recent Mortgage that was taken out on this home.
Original Mortgage
$100,000
Outstanding Balance
$25,795
Interest Rate
7.02%
Estimated Equity
$535,675
Create a Home Valuation Report for This Property
The Home Valuation Report is an in-depth analysis detailing your home's value as well as a comparison with similar homes in the area
Home Values in the Area
Average Home Value in this Area
Purchase History
| Date | Buyer | Sale Price | Title Company |
|---|---|---|---|
| Brown Michael A | $125,000 | -- |
Source: Public Records
Mortgage History
| Date | Status | Borrower | Loan Amount |
|---|---|---|---|
| Open | Brown Michael A | $60,000 | |
| Closed | Brown Michael A | $60,000 | |
| Open | Brown Michael A | $100,000 |
Source: Public Records
Tax History Compared to Growth
Tax History
| Year | Tax Paid | Tax Assessment Tax Assessment Total Assessment is a certain percentage of the fair market value that is determined by local assessors to be the total taxable value of land and additions on the property. | Land | Improvement |
|---|---|---|---|---|
| 2024 | $7,521 | $384,100 | $112,000 | $272,100 |
| 2023 | $7,244 | $384,100 | $112,000 | $272,100 |
| 2022 | $7,006 | $384,100 | $112,000 | $272,100 |
| 2021 | $6,791 | $384,100 | $112,000 | $272,100 |
| 2020 | $6,757 | $274,000 | $84,300 | $189,700 |
| 2019 | $6,664 | $274,000 | $84,300 | $189,700 |
| 2018 | $6,488 | $274,000 | $84,300 | $189,700 |
| 2017 | $6,390 | $274,000 | $84,300 | $189,700 |
| 2016 | $6,340 | $274,000 | $84,300 | $189,700 |
| 2015 | $6,151 | $262,400 | $77,300 | $185,100 |
| 2014 | $6,166 | $262,400 | $77,300 | $185,100 |
| 2013 | $5,949 | $262,400 | $77,300 | $185,100 |
Source: Public Records
Map
Nearby Homes