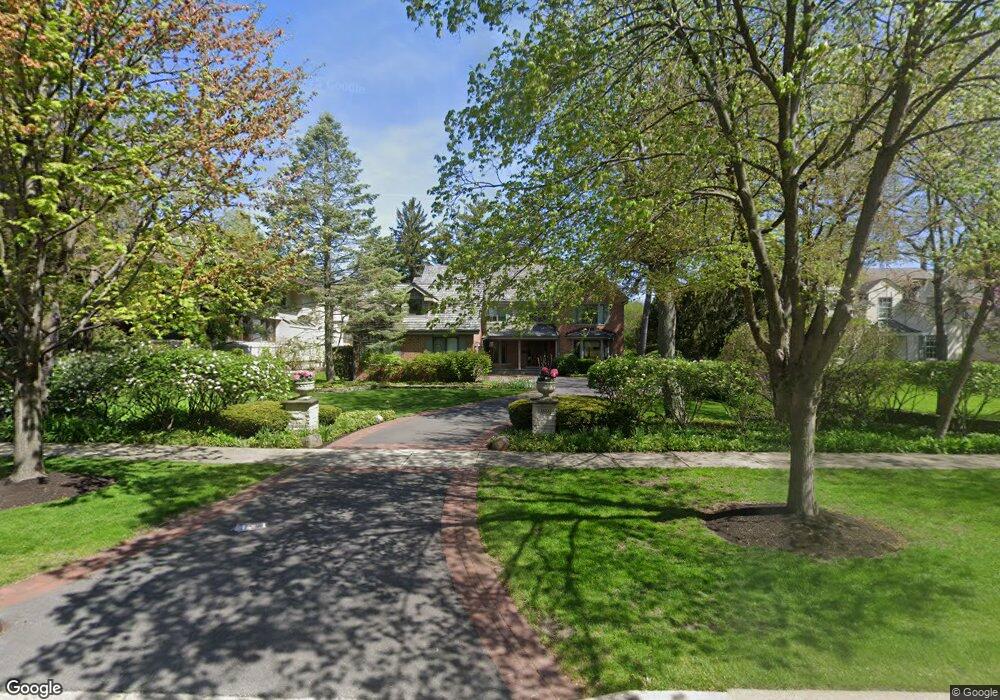
389 Washington Ave Glencoe, IL 60022
Estimated Value: $2,019,000 - $2,728,000
4
Beds
6
Baths
4,314
Sq Ft
$547/Sq Ft
Est. Value
About This Home
This home is located at 389 Washington Ave, Glencoe, IL 60022 and is currently estimated at $2,357,923, approximately $546 per square foot. 389 Washington Ave is a home located in Cook County with nearby schools including South Elementary School, Central School, and West School.
Ownership History
Date
Name
Owned For
Owner Type
Purchase Details
Closed on
Jun 4, 2013
Sold by
Bliwas Nichol L
Bought by
Bliwas Nichol Lydia and Nichol Lydia Bliwas 2001 Declaration Of
Current Estimated Value
Purchase Details
Closed on
Nov 24, 2009
Sold by
Bliwas Michael C and Bliwas Nichol L
Bought by
Bliwas Nichol L
Purchase Details
Closed on
Jun 1, 2001
Sold by
Bunce William P and Bunce Jayne M
Bought by
Bliwas Michael C and Bliwas Nichol L
Home Financials for this Owner
Home Financials are based on the most recent Mortgage that was taken out on this home.
Original Mortgage
$1,000,000
Outstanding Balance
$383,979
Interest Rate
7.25%
Estimated Equity
$1,973,944
Purchase Details
Closed on
Aug 15, 1997
Sold by
Kelly Frank C and Kelly Noreen C
Bought by
Bunce William P and Bunce Jayne M
Home Financials for this Owner
Home Financials are based on the most recent Mortgage that was taken out on this home.
Original Mortgage
$550,000
Interest Rate
7.62%
Create a Home Valuation Report for This Property
The Home Valuation Report is an in-depth analysis detailing your home's value as well as a comparison with similar homes in the area
Home Values in the Area
Average Home Value in this Area
Purchase History
| Date | Buyer | Sale Price | Title Company |
|---|---|---|---|
| Bliwas Nichol Lydia | -- | None Available | |
| Bliwas Nichol L | -- | None Available | |
| Bliwas Michael C | $1,240,000 | -- | |
| Bunce William P | $530,666 | Land Title Group Inc |
Source: Public Records
Mortgage History
| Date | Status | Borrower | Loan Amount |
|---|---|---|---|
| Open | Bliwas Michael C | $1,000,000 | |
| Previous Owner | Bunce William P | $550,000 |
Source: Public Records
Tax History Compared to Growth
Tax History
| Year | Tax Paid | Tax Assessment Tax Assessment Total Assessment is a certain percentage of the fair market value that is determined by local assessors to be the total taxable value of land and additions on the property. | Land | Improvement |
|---|---|---|---|---|
| 2024 | $34,908 | $142,509 | $36,600 | $105,909 |
| 2023 | $32,591 | $142,509 | $36,600 | $105,909 |
| 2022 | $32,591 | $142,509 | $36,600 | $105,909 |
| 2021 | $32,625 | $113,797 | $26,352 | $87,445 |
| 2020 | $34,314 | $123,280 | $26,352 | $96,928 |
| 2019 | $33,139 | $134,000 | $26,352 | $107,648 |
| 2018 | $34,709 | $136,537 | $23,424 | $113,113 |
| 2017 | $33,721 | $136,537 | $23,424 | $113,113 |
| 2016 | $31,660 | $136,537 | $23,424 | $113,113 |
| 2015 | $31,665 | $120,900 | $19,398 | $101,502 |
| 2014 | $30,883 | $120,900 | $19,398 | $101,502 |
| 2013 | $29,459 | $120,900 | $19,398 | $101,502 |
Source: Public Records
Map
Nearby Homes
- 340 Hawthorn Ave
- 410 Green Bay Rd
- 313 Hawthorn Ave Unit 313F
- 580 Green Bay Rd Unit 580
- 315 Hawthorn Ave Unit E
- 590 Green Bay Rd Unit 590
- 630 Vernon Ave Unit 10
- 1 Briar Ln
- 655 Bluff St
- 265 Randolph St
- 794 Greenwood Ave
- 312 Jackson Ave Unit 312
- 320 Keystone Ct
- 829 Greenwood Ave
- 150 Linden Ave
- 396 Forest Edge Dr
- 540 Green Bay Rd
- 863 Vernon Ave
- 767 Ivy Ln
- 219 Lincoln Dr
- 395 Washington Ave
- 385 Washington Ave
- 375 Washington Ave
- 401 Washington Ave
- 366 South Ave
- 374 South Ave
- 362 South Ave
- 376 South Ave
- 411 Washington Ave
- 524 Vernon Ave
- 380 Washington Ave
- 396 Washington Ave
- 392 Washington Ave
- 505 Vernon Ave
- 400 Washington Ave
- 390 South Ave
- 414 Washington Ave
- 414 Washington Ave
- 363 Washington Ave
- 545 Greenwood Ave