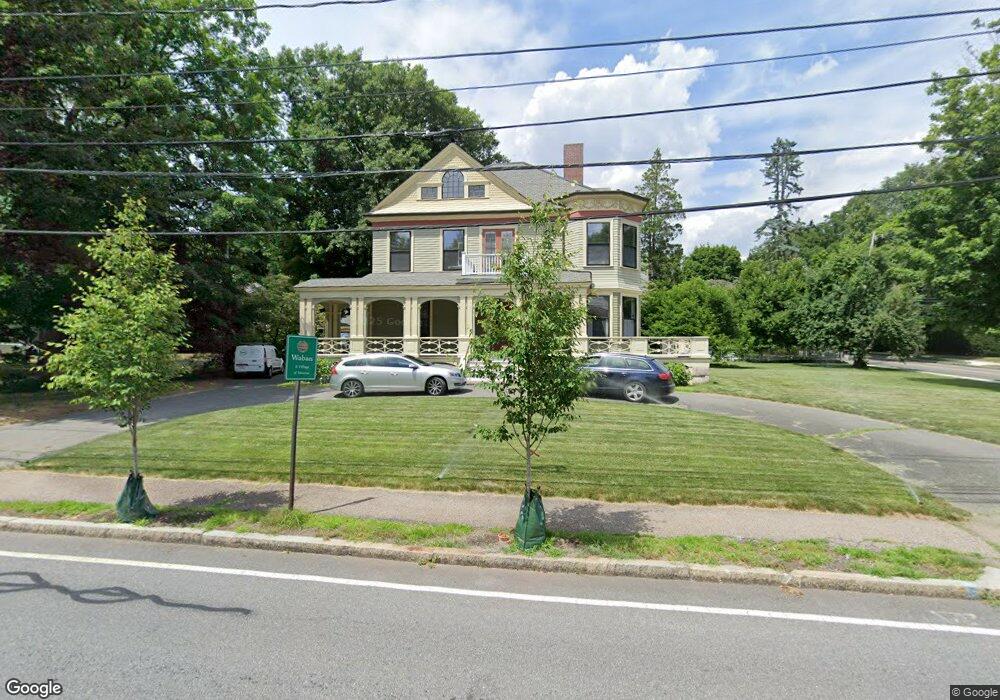
389 Woodward St Waban, MA 02468
Waban NeighborhoodEstimated Value: $2,275,868 - $2,735,000
5
Beds
4
Baths
3,680
Sq Ft
$676/Sq Ft
Est. Value
About This Home
This home is located at 389 Woodward St, Waban, MA 02468 and is currently estimated at $2,487,217, approximately $675 per square foot. 389 Woodward St is a home located in Middlesex County with nearby schools including Angier Elementary School, Charles E Brown Middle School, and Newton South High School.
Ownership History
Date
Name
Owned For
Owner Type
Purchase Details
Closed on
Aug 1, 2001
Sold by
Recicar Warren L and Recicar Michelle N
Bought by
Gold Jonathan and Gold Marjorie R
Current Estimated Value
Home Financials for this Owner
Home Financials are based on the most recent Mortgage that was taken out on this home.
Original Mortgage
$150,000
Outstanding Balance
$58,470
Interest Rate
7.14%
Mortgage Type
Purchase Money Mortgage
Estimated Equity
$2,428,747
Purchase Details
Closed on
Apr 28, 1999
Sold by
Lambert Rt and Lambert Dorothy I
Bought by
Recicar Warren L and Recicar Michelle N
Home Financials for this Owner
Home Financials are based on the most recent Mortgage that was taken out on this home.
Original Mortgage
$500,000
Interest Rate
6.95%
Mortgage Type
Purchase Money Mortgage
Create a Home Valuation Report for This Property
The Home Valuation Report is an in-depth analysis detailing your home's value as well as a comparison with similar homes in the area
Home Values in the Area
Average Home Value in this Area
Purchase History
| Date | Buyer | Sale Price | Title Company |
|---|---|---|---|
| Gold Jonathan | $915,000 | -- | |
| Recicar Warren L | $765,000 | -- |
Source: Public Records
Mortgage History
| Date | Status | Borrower | Loan Amount |
|---|---|---|---|
| Open | Recicar Warren L | $150,000 | |
| Previous Owner | Recicar Warren L | $500,000 |
Source: Public Records
Tax History Compared to Growth
Tax History
| Year | Tax Paid | Tax Assessment Tax Assessment Total Assessment is a certain percentage of the fair market value that is determined by local assessors to be the total taxable value of land and additions on the property. | Land | Improvement |
|---|---|---|---|---|
| 2025 | $19,608 | $2,000,800 | $1,237,600 | $763,200 |
| 2024 | $20,278 | $2,077,700 | $1,261,700 | $816,000 |
| 2023 | $19,332 | $1,899,000 | $989,900 | $909,100 |
| 2022 | $18,497 | $1,758,300 | $916,600 | $841,700 |
| 2021 | $17,849 | $1,658,800 | $864,700 | $794,100 |
| 2020 | $17,318 | $1,658,800 | $864,700 | $794,100 |
| 2019 | $16,830 | $1,610,500 | $839,500 | $771,000 |
| 2018 | $16,294 | $1,505,900 | $752,300 | $753,600 |
| 2017 | $15,798 | $1,420,700 | $709,700 | $711,000 |
| 2016 | $15,110 | $1,327,800 | $663,300 | $664,500 |
| 2015 | $14,407 | $1,240,900 | $619,900 | $621,000 |
Source: Public Records
Map
Nearby Homes
- 80 Pine Ridge Rd
- 29 Montclair Rd
- 20 Kinmonth Rd Unit 203
- 20 Kinmonth Rd Unit 306
- 18 Annawan Rd
- 1430 Beacon St
- 115 Windsor Rd
- 25 Allen Ave
- 131 Oliver Rd
- 120 Stanley Rd
- 873 Chestnut St
- 34 Pilgrim Rd
- 1801 Beacon St
- 35 Kingston Rd
- 33 Metacomet Rd
- 200 Lincoln St
- 1077 Boylston St
- 992 Chestnut St
- 17 Circuit Ave Unit 2
- 1003 Chestnut St
- 677 Chestnut St
- 397 Woodward St
- 390 Woodward St
- 401 Woodward St
- 398 Woodward St
- 688 Chestnut St
- 682 Chestnut St
- 667 Chestnut St
- 703 Chestnut St
- 406 Woodward St
- 672 Chestnut St
- 702 Chestnut St
- 367 Woodward St
- 425 Woodward St
- 659 Chestnut St
- 711 Chestnut St
- 711 Chestnut St Unit 3
- 414 Woodward St
- 170 Pine Ridge Rd
- 162 Pine Ridge Rd