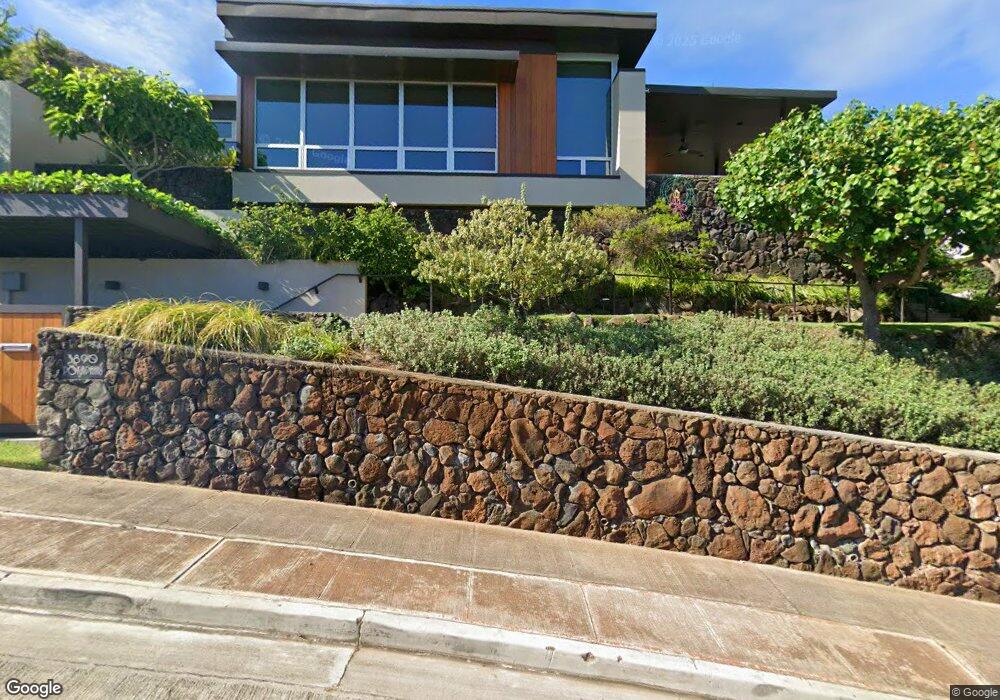
3890 Pokapahu Place Honolulu, HI 96816
Kahala NeighborhoodEstimated Value: $5,588,003 - $6,129,000
4
Beds
5
Baths
5,330
Sq Ft
$1,116/Sq Ft
Est. Value
About This Home
This home is located at 3890 Pokapahu Place, Honolulu, HI 96816 and is currently estimated at $5,946,668, approximately $1,115 per square foot. 3890 Pokapahu Place is a home located in Honolulu County with nearby schools including Kahala Elementary School, Kaimuki Middle School, and Kalani High School.
Ownership History
Date
Name
Owned For
Owner Type
Purchase Details
Closed on
Jan 17, 2018
Sold by
Moore Patricia Ann Lloyd and Moore David Llewellyn
Bought by
Moore Patricia Ann Lloyd and The Non Exempt Geneartion Skip
Current Estimated Value
Purchase Details
Closed on
Oct 22, 2007
Sold by
Moore Patricia Ann Lloyd
Bought by
Moore Patricia Ann Lloyd and Patricia Ann Lloyd Moore Revocable Livin
Purchase Details
Closed on
Aug 5, 2004
Sold by
Moore Catherine Evans Lloyd
Bought by
Moore Patricia Ann Lloyd
Purchase Details
Closed on
Sep 24, 2002
Sold by
Moore Richard Dixon and Moore Catherine Evans Lloyd
Bought by
Moore Richard D and Richard D Moore Revocable Living Trust
Purchase Details
Closed on
Jan 14, 1997
Sold by
Moore Catherine Evans Lloyd
Bought by
Moore Catherine Evans Lloyd
Purchase Details
Closed on
Sep 27, 1996
Sold by
Moore Catherine Evans Lloyd
Bought by
Moore Catherine Evans Lloyd
Purchase Details
Closed on
Sep 14, 1995
Sold by
Moore Catherine Evans Lloyd
Bought by
Moore Catherine Evans Lloyd
Create a Home Valuation Report for This Property
The Home Valuation Report is an in-depth analysis detailing your home's value as well as a comparison with similar homes in the area
Home Values in the Area
Average Home Value in this Area
Purchase History
| Date | Buyer | Sale Price | Title Company |
|---|---|---|---|
| Moore Patricia Ann Lloyd | -- | None Available | |
| Moore Patricia Ann Lloyd | -- | None Available | |
| Moore Patricia Ann Lloyd | -- | None Available | |
| Moore Patricia Ann Lloyd | -- | -- | |
| Moore Richard D | -- | -- | |
| Moore Catherine Evans Lloyd | -- | -- | |
| Moore Catherine Evans Lloyd | -- | -- | |
| Moore Catherine Evans Lloyd | -- | -- |
Source: Public Records
Tax History Compared to Growth
Tax History
| Year | Tax Paid | Tax Assessment Tax Assessment Total Assessment is a certain percentage of the fair market value that is determined by local assessors to be the total taxable value of land and additions on the property. | Land | Improvement |
|---|---|---|---|---|
| 2025 | $14,242 | $3,806,500 | $2,469,200 | $1,337,300 |
| 2024 | $14,242 | $4,229,000 | $2,777,900 | $1,451,100 |
| 2023 | $14,478 | $4,276,700 | $2,675,000 | $1,601,700 |
| 2022 | $11,522 | $3,431,900 | $2,366,400 | $1,065,500 |
| 2021 | $10,499 | $3,139,600 | $1,913,700 | $1,225,900 |
| 2020 | $10,894 | $3,212,600 | $1,954,800 | $1,257,800 |
| 2019 | $10,981 | $3,217,500 | $2,006,300 | $1,211,200 |
| 2018 | $15,084 | $4,389,600 | $2,078,300 | $2,311,300 |
| 2017 | $14,457 | $4,250,600 | $2,325,200 | $1,925,400 |
| 2016 | $13,643 | $4,018,100 | $2,510,400 | $1,507,700 |
| 2015 | $16,273 | $4,769,300 | $2,459,000 | $2,310,300 |
| 2014 | $6,286 | $2,295,900 | $1,844,700 | $451,200 |
Source: Public Records
Map
Nearby Homes
- 3857 Poka St
- 213 Kaalawai Place
- 218 Kaalawai Place
- 4218 Kaimanahila St
- 3735 Diamond Head Rd Unit A
- 3735 Diamond Head Rd
- 4105 Papu Cir
- 4316 Papu Cir
- 4219 Kaikoo Place
- 542 Ahina St
- 4305 Kaikoo Place
- 4125 Black Point Rd
- 4240 Kaikoo Place
- 4131 Black Point Place
- 4417A Puu Panini Ave
- 736 Ulili St
- 4504 Kahala Ave
- 4536 Kolohala St
- 4505 Kahala Ave
- 4543 Aukai Ave
- 628 Pana Place
- 626 Pana Place
- 3889 Pokapahu Place
- 3876 Pokapahu Place
- 3879 Pokapahu Place
- 630 Pana Place
- 605 Paikau St
- 3868 Pokapahu Place Unit 1205
- 615 Paikau St
- 3898 Poka St
- 3886 Poka St
- 625 Pana Place
- 591 Paikau St
- 3860 Pokapahu Place
- 3878 Poka St
- 633 Pana Place
- 3859 Pokapahu Place Unit 11
- 623 Paikau St
- 3924 Kaualio Place
- 3868 Poka St