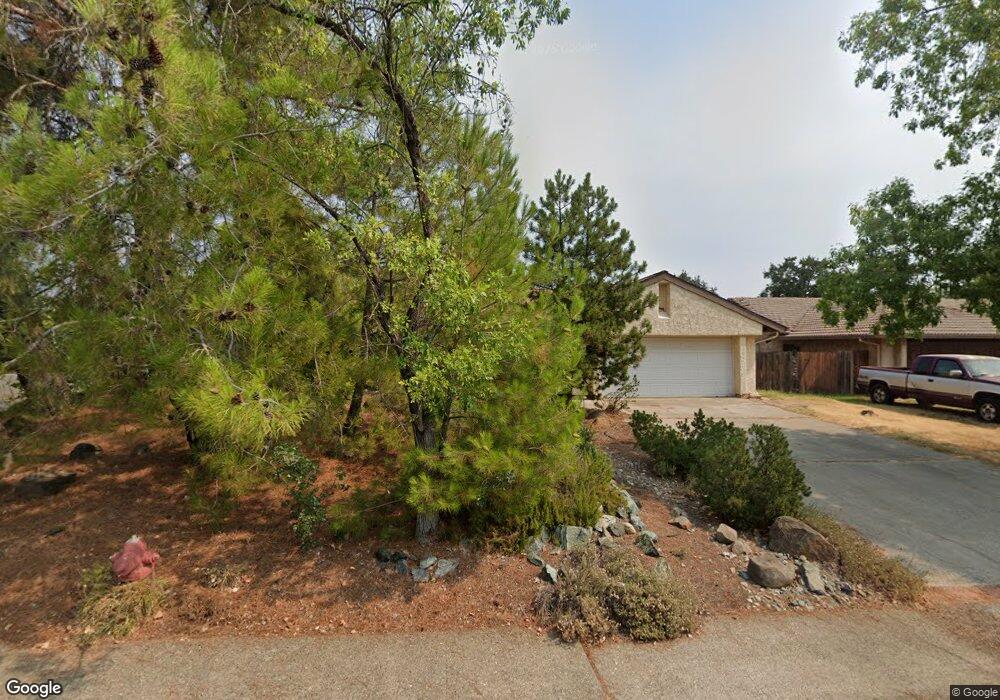
3890 Wasatch Dr Unit SFR Redding, CA 96001
Ridgeview NeighborhoodEstimated Value: $409,566 - $443,000
3
Beds
2
Baths
1,685
Sq Ft
$249/Sq Ft
Est. Value
About This Home
This home is located at 3890 Wasatch Dr Unit SFR, Redding, CA 96001 and is currently estimated at $420,392, approximately $249 per square foot. 3890 Wasatch Dr Unit SFR is a home located in Shasta County with nearby schools including Manzanita Elementary School, Sequoia Middle School, and Shasta High School.
Ownership History
Date
Name
Owned For
Owner Type
Purchase Details
Closed on
Sep 24, 2010
Sold by
Fazzari Misty
Bought by
Fazzari Christopher
Current Estimated Value
Purchase Details
Closed on
Jul 16, 2009
Sold by
Fazzari Christopher A and Fazzari Misty
Bought by
Fazzari Christopher A and Fazzari Misty
Home Financials for this Owner
Home Financials are based on the most recent Mortgage that was taken out on this home.
Original Mortgage
$187,000
Outstanding Balance
$123,773
Interest Rate
5.59%
Mortgage Type
Stand Alone Refi Refinance Of Original Loan
Estimated Equity
$296,619
Purchase Details
Closed on
Mar 6, 2001
Sold by
Semingson Karen E
Bought by
Fazzari Christopher and Fazzari Misty
Home Financials for this Owner
Home Financials are based on the most recent Mortgage that was taken out on this home.
Original Mortgage
$132,850
Interest Rate
7.11%
Mortgage Type
Purchase Money Mortgage
Create a Home Valuation Report for This Property
The Home Valuation Report is an in-depth analysis detailing your home's value as well as a comparison with similar homes in the area
Home Values in the Area
Average Home Value in this Area
Purchase History
| Date | Buyer | Sale Price | Title Company |
|---|---|---|---|
| Fazzari Christopher | -- | None Available | |
| Fazzari Christopher A | -- | Fidelity Natl Title Co Of Ca | |
| Fazzari Christopher | $137,000 | Chicago Title Co |
Source: Public Records
Mortgage History
| Date | Status | Borrower | Loan Amount |
|---|---|---|---|
| Open | Fazzari Christopher A | $187,000 | |
| Closed | Fazzari Christopher | $132,850 |
Source: Public Records
Tax History
| Year | Tax Paid | Tax Assessment Tax Assessment Total Assessment is a certain percentage of the fair market value that is determined by local assessors to be the total taxable value of land and additions on the property. | Land | Improvement |
|---|---|---|---|---|
| 2025 | $2,295 | $218,677 | $42,178 | $176,499 |
| 2024 | $2,258 | $214,390 | $41,351 | $173,039 |
| 2023 | $2,258 | $210,188 | $40,541 | $169,647 |
| 2022 | $2,219 | $206,068 | $39,747 | $166,321 |
| 2021 | $2,200 | $202,028 | $38,968 | $163,060 |
| 2020 | $2,224 | $199,958 | $38,569 | $161,389 |
| 2019 | $2,113 | $196,038 | $37,813 | $158,225 |
| 2018 | $2,128 | $192,195 | $37,072 | $155,123 |
| 2017 | $2,114 | $188,428 | $36,346 | $152,082 |
| 2016 | $2,047 | $184,734 | $35,634 | $149,100 |
| 2015 | $1,986 | $181,960 | $35,099 | $146,861 |
| 2014 | $2,003 | $178,397 | $34,412 | $143,985 |
Source: Public Records
Map
Nearby Homes
- 3882 Fujiyama Way
- 4065 Meander Dr
- 4125 Oro St
- 4160 Travona Ct
- 1695 Kildare Dr
- 1846 Kildare Dr
- 1692 Kildare Dr
- 2242 Everest Dr
- 1974 Kildare Dr
- 3701 Cal Ore Dr
- 1783 Record Ln
- 3380 Placer St
- 2358 Cumberland Dr
- 2135 Adirondack Dr
- 1756 Mary Lake Dr
- 1426 Gladstone Ct
- 4478 Moyvane Dr
- 4519 Nantucket Dr
- 3345 Oakwood Place
- 1355 Bambury Ct
- 3890 Wasatch Dr
- 3870 Wasatch Dr
- 3883 Fujiyama Way
- 3850 Wasatch Dr
- 1876 Cumberland Dr
- 1828 Cumberland Dr
- 3891 Wasatch Dr
- 3873 Wasatch Dr Unit 1
- 3873 Wasatch Dr
- 3855 Fujiyama Way
- 3830 Wasatch Dr
- 3837 Fujiyama Way
- 3825 Fujiyama Way
- 1930 Cumberland Dr
- 4005 Meander Dr
- 3855 Wasatch Dr
- 4000 Meander Dr
- 3813 Fujiyama Way
- 3810 Wasatch Dr
- 3894 Fujiyama Way
Your Personal Tour Guide
Ask me questions while you tour the home.