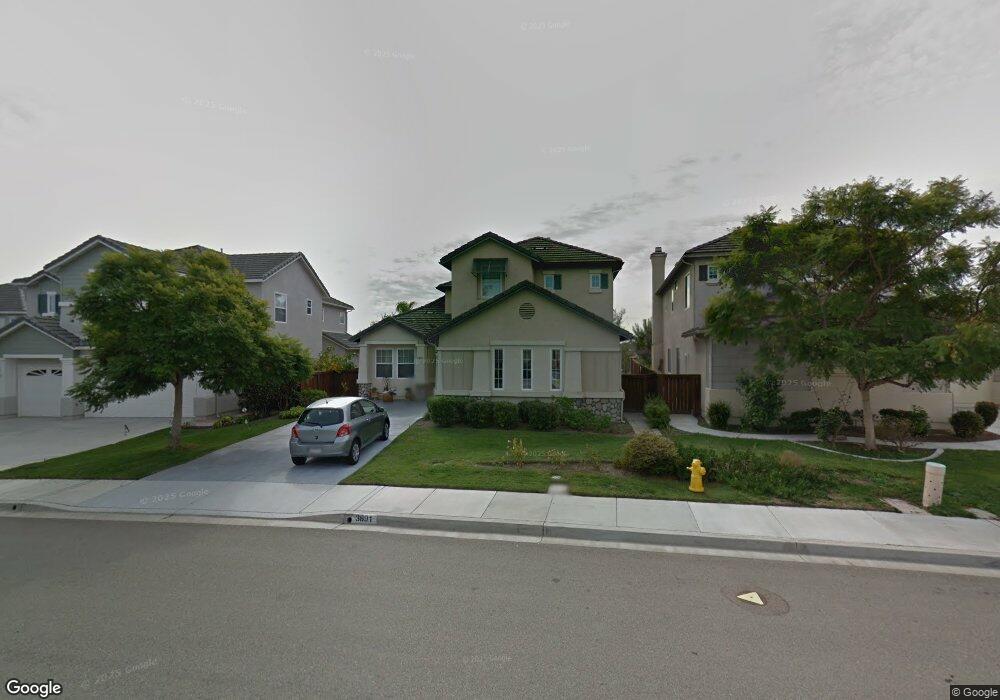
3891 Stoneridge Rd Carlsbad, CA 92010
Calavera Hills NeighborhoodEstimated Value: $1,422,882 - $1,618,000
3
Beds
3
Baths
2,585
Sq Ft
$589/Sq Ft
Est. Value
About This Home
This home is located at 3891 Stoneridge Rd, Carlsbad, CA 92010 and is currently estimated at $1,521,971, approximately $588 per square foot. 3891 Stoneridge Rd is a home located in San Diego County with nearby schools including Calavera Hills Elementary, Calavera Hills Middle, and Sage Creek High.
Ownership History
Date
Name
Owned For
Owner Type
Purchase Details
Closed on
Nov 3, 2004
Sold by
Wang Shiu H and Wang Kim H
Bought by
Wang Shiu H and Wang Kim H
Current Estimated Value
Purchase Details
Closed on
Nov 7, 2001
Sold by
Wang Shiu Hua and Wang Kim Hua
Bought by
Wang Shiu Hua and Wang Kim Hua
Home Financials for this Owner
Home Financials are based on the most recent Mortgage that was taken out on this home.
Original Mortgage
$150,000
Interest Rate
6.62%
Purchase Details
Closed on
May 18, 2000
Sold by
Nantucket 149 L L C
Bought by
Wang Kim Hua and Wang Shui Hua
Home Financials for this Owner
Home Financials are based on the most recent Mortgage that was taken out on this home.
Original Mortgage
$172,990
Interest Rate
8.01%
Create a Home Valuation Report for This Property
The Home Valuation Report is an in-depth analysis detailing your home's value as well as a comparison with similar homes in the area
Home Values in the Area
Average Home Value in this Area
Purchase History
| Date | Buyer | Sale Price | Title Company |
|---|---|---|---|
| Wang Shiu H | -- | -- | |
| Wang Shiu Hua | -- | Fidelity National Title Co | |
| Wang Kim Hua | $353,000 | First American Title |
Source: Public Records
Mortgage History
| Date | Status | Borrower | Loan Amount |
|---|---|---|---|
| Closed | Wang Shiu Hua | $150,000 | |
| Previous Owner | Wang Kim Hua | $172,990 |
Source: Public Records
Tax History Compared to Growth
Tax History
| Year | Tax Paid | Tax Assessment Tax Assessment Total Assessment is a certain percentage of the fair market value that is determined by local assessors to be the total taxable value of land and additions on the property. | Land | Improvement |
|---|---|---|---|---|
| 2025 | $6,318 | $531,879 | $210,949 | $320,930 |
| 2024 | $6,318 | $521,451 | $206,813 | $314,638 |
| 2023 | $6,288 | $511,227 | $202,758 | $308,469 |
| 2022 | $6,202 | $501,204 | $198,783 | $302,421 |
| 2021 | $6,160 | $491,378 | $194,886 | $296,492 |
| 2020 | $6,123 | $486,340 | $192,888 | $293,452 |
| 2019 | $6,026 | $476,805 | $189,106 | $287,699 |
| 2018 | $5,804 | $467,457 | $185,399 | $282,058 |
| 2017 | $5,719 | $458,292 | $181,764 | $276,528 |
| 2016 | $5,519 | $449,306 | $178,200 | $271,106 |
| 2015 | $5,500 | $442,558 | $175,524 | $267,034 |
| 2014 | $5,420 | $433,890 | $172,086 | $261,804 |
Source: Public Records
Map
Nearby Homes
- 4060 Alto St
- 3840 Stoneridge Rd
- 3545 Knollwood Dr
- 4225 Dusk Ln
- 3456 Thunder Dr
- 3579 Twilight Ln
- 3436 Thunder Dr
- 3442 Thunder Dr
- 3468 Los Mochis Way
- 3434 Seabreeze Walk
- 3458 Los Mochis Way
- 3433 Los Mochis Way
- 200 Bright Creek Ln Unit 200
- 3618 Milford Place
- 2130 Sunset Dr Unit 73
- 2130 Sunset Dr Unit 55
- 2130 Sunset Dr Unit SPC 94
- 2130 Sunset Dr Unit 134
- 2130 Sunset Dr Unit 14
- 2130 Sunset Dr Unit 135
- 3887 Stoneridge Rd
- 3895 Stoneridge Rd
- 3883 Stoneridge Rd
- 3899 Stoneridge Rd
- 3879 Stoneridge Rd
- 3903 Stoneridge Rd
- 3892 Stoneridge Rd
- 3888 Stoneridge Rd
- 3875 Stoneridge Rd
- 3900 Stoneridge Rd
- 3525 Hummock Dr
- 3907 Stoneridge Rd
- 3884 Stoneridge Rd
- 3902 Rill Ct
- 3906 Rill Ct
- 3904 Stoneridge Rd
- 3512 Levee Dr
- 3529 Hummock Dr
- 3910 Rill Ct
- 3508 Levee Dr