Estimated Value: $370,000 - $537,000
2
Beds
1
Bath
720
Sq Ft
$665/Sq Ft
Est. Value
About This Home
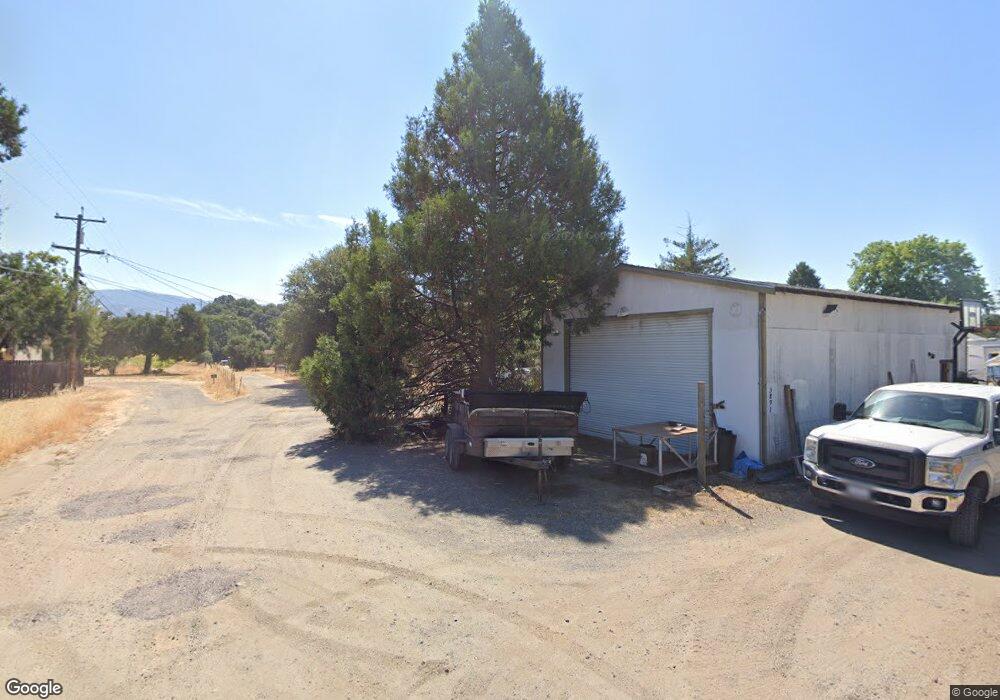
This home is located at 3893 Eastside Calpella Rd, Ukiah, CA 95482 and is currently estimated at $478,501, approximately $664 per square foot. 3893 Eastside Calpella Rd is a home located in Mendocino County with nearby schools including Pomolita Middle School, Ukiah High School, and Tree of Life Charter School.
Ownership History
Date
Name
Owned For
Owner Type
Purchase Details
Closed on
Apr 21, 2009
Sold by
Potter Stuart C and Billups Kristin A
Bought by
Billups Kristin A and Potter Stuart C
Current Estimated Value
Purchase Details
Closed on
Feb 11, 2009
Sold by
Billups Dick B
Bought by
Billups Kristin A
Purchase Details
Closed on
Jun 29, 2004
Sold by
Armstrong Mark E
Bought by
Potter Stuart C and Billups Dick B
Home Financials for this Owner
Home Financials are based on the most recent Mortgage that was taken out on this home.
Original Mortgage
$220,000
Outstanding Balance
$110,268
Interest Rate
6.27%
Mortgage Type
Unknown
Estimated Equity
$368,233
Purchase Details
Closed on
Apr 15, 2004
Sold by
Armstrong William E
Bought by
Armstrong Mark E
Create a Home Valuation Report for This Property
The Home Valuation Report is an in-depth analysis detailing your home's value as well as a comparison with similar homes in the area
Home Values in the Area
Average Home Value in this Area
Purchase History
| Date | Buyer | Sale Price | Title Company |
|---|---|---|---|
| Billups Kristin A | -- | Fidelity Natl Title Co Of Ca | |
| Billups Kristin A | -- | Accommodation | |
| Potter Stuart C | $295,000 | First American Title Co | |
| Armstrong Mark E | -- | First American Title Co |
Source: Public Records
Mortgage History
| Date | Status | Borrower | Loan Amount |
|---|---|---|---|
| Open | Potter Stuart C | $220,000 |
Source: Public Records
Tax History Compared to Growth
Tax History
| Year | Tax Paid | Tax Assessment Tax Assessment Total Assessment is a certain percentage of the fair market value that is determined by local assessors to be the total taxable value of land and additions on the property. | Land | Improvement |
|---|---|---|---|---|
| 2025 | $5,026 | $411,189 | $229,986 | $181,203 |
| 2023 | $5,026 | $395,223 | $221,056 | $174,167 |
| 2022 | $4,816 | $387,474 | $216,722 | $170,752 |
| 2021 | $4,840 | $379,877 | $212,473 | $167,404 |
| 2020 | $4,774 | $375,984 | $210,296 | $165,688 |
| 2019 | $4,520 | $368,611 | $206,172 | $162,439 |
| 2018 | $4,414 | $361,384 | $202,130 | $159,254 |
| 2017 | $4,346 | $354,298 | $198,167 | $156,131 |
| 2016 | $4,224 | $347,354 | $194,283 | $153,071 |
| 2015 | $4,192 | $342,138 | $191,365 | $150,773 |
| 2014 | $4,101 | $335,438 | $187,618 | $147,820 |
Source: Public Records
Map
Nearby Homes
- 548 Milani Dr
- 360 Milani Dr
- 890 Lake Mendocino Dr
- 66 Bonita Place
- 36 Blanco Place
- 23 Blanco Place
- 24 Blanco Place
- 751 Lake Mendocino Dr
- 801 Lake Mendocino Dr
- 3110 Redemeyer Rd
- 3198 van Housen Dr
- 3800 N State St Unit 103
- 311 Lake Mendocino Dr Unit 10
- 311 Lake Mendocino Dr Unit 9
- 4561 Lake Ridge Rd
- 4901 Eastside Calpella Rd
- 4801 N State St Unit 33
- 4801 N State St Unit 15
- 4801 N State St Unit 48
- 5851 Lake Ridge Rd
- 3841 Eastside Calpella Rd
- 3835 Eastside Calpella Rd
- 3897 Eastside Calpella Rd
- 3851 Eastside Calpella Rd
- 3831 Eastside Calpella Rd
- 3775 Eastside Calpella Rd
- 3791 Eastside Calpella Rd
- 3820 Eastside Calpella Rd
- 3861 Eastside Calpella Rd
- 3840 Eastside Calpella Rd
- 3811 Eastside Calpella Rd
- 3850 Eastside Calpella Rd
- 3790 Eastside Calpella Rd
- 3810 Eastside Calpella Rd
- 3800 Eastside Calpella Rd
- 460 Hardwick Rd
- 3900 Eastside Calpella Rd
- 3785 Eastside Calpella Rd
- 3801 Eastside Calpella Rd
- 451 Stutsman Rd