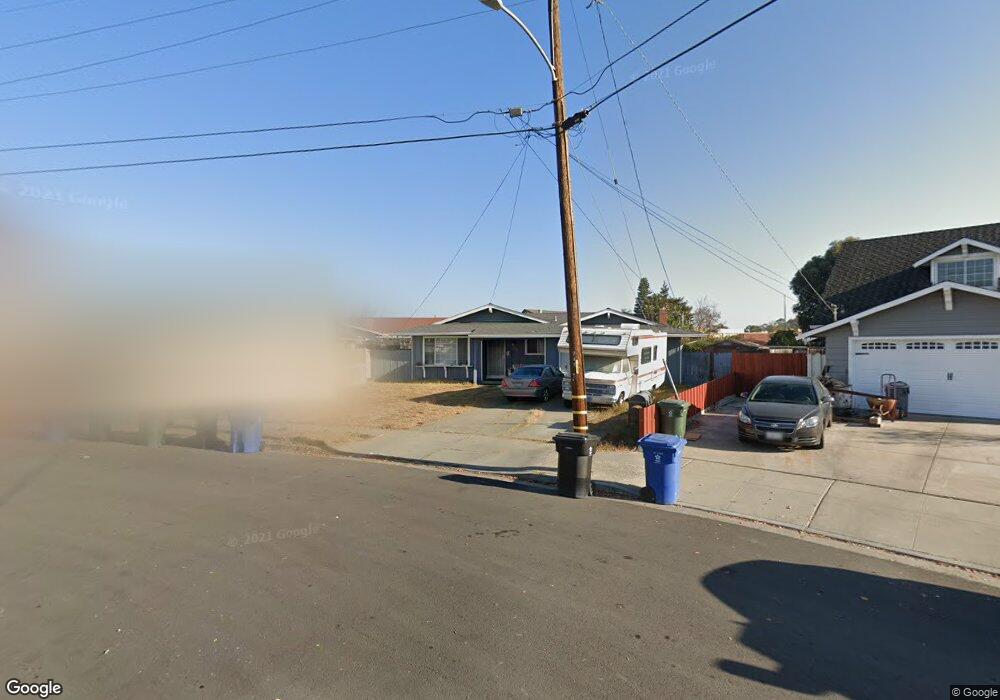
38934 Larkspur St Newark, CA 94560
Birch Grove NeighborhoodEstimated Value: $1,313,185 - $1,503,000
4
Beds
2
Baths
1,522
Sq Ft
$906/Sq Ft
Est. Value
About This Home
This home is located at 38934 Larkspur St, Newark, CA 94560 and is currently estimated at $1,378,296, approximately $905 per square foot. 38934 Larkspur St is a home located in Alameda County with nearby schools including Birch Grove Primary School, Newark Junior High School, and Newark Memorial High School.
Ownership History
Date
Name
Owned For
Owner Type
Purchase Details
Closed on
Jan 12, 2007
Sold by
Ramirez Adela and Ramirez Sonia M
Bought by
Interv Ramirez Adela and Interv Adela Ramirez Revocable
Current Estimated Value
Purchase Details
Closed on
Nov 5, 2003
Sold by
Gutierrez Mark and Gutierrez Sonia M
Bought by
Gutierrez Sonia
Home Financials for this Owner
Home Financials are based on the most recent Mortgage that was taken out on this home.
Original Mortgage
$100,000
Outstanding Balance
$46,006
Interest Rate
5.89%
Mortgage Type
Purchase Money Mortgage
Estimated Equity
$1,332,290
Purchase Details
Closed on
Dec 16, 1993
Sold by
Ramirez Adela
Bought by
Ramirez Adela and Ramirez Sonia M
Home Financials for this Owner
Home Financials are based on the most recent Mortgage that was taken out on this home.
Original Mortgage
$79,500
Interest Rate
7.09%
Create a Home Valuation Report for This Property
The Home Valuation Report is an in-depth analysis detailing your home's value as well as a comparison with similar homes in the area
Home Values in the Area
Average Home Value in this Area
Purchase History
| Date | Buyer | Sale Price | Title Company |
|---|---|---|---|
| Interv Ramirez Adela | -- | None Available | |
| Gutierrez Sonia | -- | Ticor Title Company | |
| Ramirez Adela | $40,000 | Fidelity National Title Co |
Source: Public Records
Mortgage History
| Date | Status | Borrower | Loan Amount |
|---|---|---|---|
| Open | Gutierrez Sonia | $100,000 | |
| Closed | Ramirez Adela | $79,500 |
Source: Public Records
Tax History
| Year | Tax Paid | Tax Assessment Tax Assessment Total Assessment is a certain percentage of the fair market value that is determined by local assessors to be the total taxable value of land and additions on the property. | Land | Improvement |
|---|---|---|---|---|
| 2025 | $3,095 | $206,823 | $106,024 | $100,799 |
| 2024 | $3,095 | $202,769 | $103,946 | $98,823 |
| 2023 | $2,995 | $198,793 | $101,908 | $96,885 |
| 2022 | $2,934 | $194,895 | $99,909 | $94,986 |
| 2021 | $2,866 | $191,075 | $97,951 | $93,124 |
| 2020 | $2,762 | $189,116 | $96,947 | $92,169 |
| 2019 | $2,728 | $185,408 | $95,046 | $90,362 |
| 2018 | $2,682 | $181,773 | $93,183 | $88,590 |
| 2017 | $2,614 | $178,210 | $91,356 | $86,854 |
| 2016 | $2,574 | $174,716 | $89,565 | $85,151 |
| 2015 | $2,564 | $172,092 | $88,220 | $83,872 |
| 2014 | $2,490 | $168,721 | $86,492 | $82,229 |
Source: Public Records
Map
Nearby Homes
- 39146 Ebbetts St
- 38976 Primula Terrace
- 5724 Pandorea Terrace
- 6318 Joaquin Murieta Ave Unit F
- 6318 Joaquin Murieta Ave Unit B
- 5659 Daylily St
- 6001 Joaquin Murieta Ave Unit C
- 6001 Joaquin Murieta Ave Unit F
- 5550 Higo Way
- 5516 Higo Way
- 5502 Higo Way
- 5513 Higo Way
- 38533 Amaranto St
- 38539 Amaranto St
- 38521 Amaranto St
- 6361 Potrero Dr
- 38515 Amaranto St
- 38509 Amaranto St
- 6257 Honeysuckle Dr
- 5845 Vizcaino Way
- 38948 Larkspur St
- 38926 Larkspur St
- 38982 Bluebell Dr
- 38990 Bluebell Dr
- 38962 Larkspur St
- 38912 Larkspur St
- 38998 Bluebell Dr
- 38947 Larkspur St
- 38974 Bluebell Dr
- 38974 Larkspur St
- 38911 Larkspur St
- 38904 Larkspur St
- 6370 Jasmine Ave
- 6420 Jasmine Ave
- 38966 Bluebell Dr
- 38980 Larkspur St
- 38979 Larkspur St
- 6353 Benecia Ave
- 6365 Benecia Ave
- 6341 Benecia Ave
Your Personal Tour Guide
Ask me questions while you tour the home.