Estimated Value: $213,000 - $227,000
3
Beds
2
Baths
1,360
Sq Ft
$162/Sq Ft
Est. Value
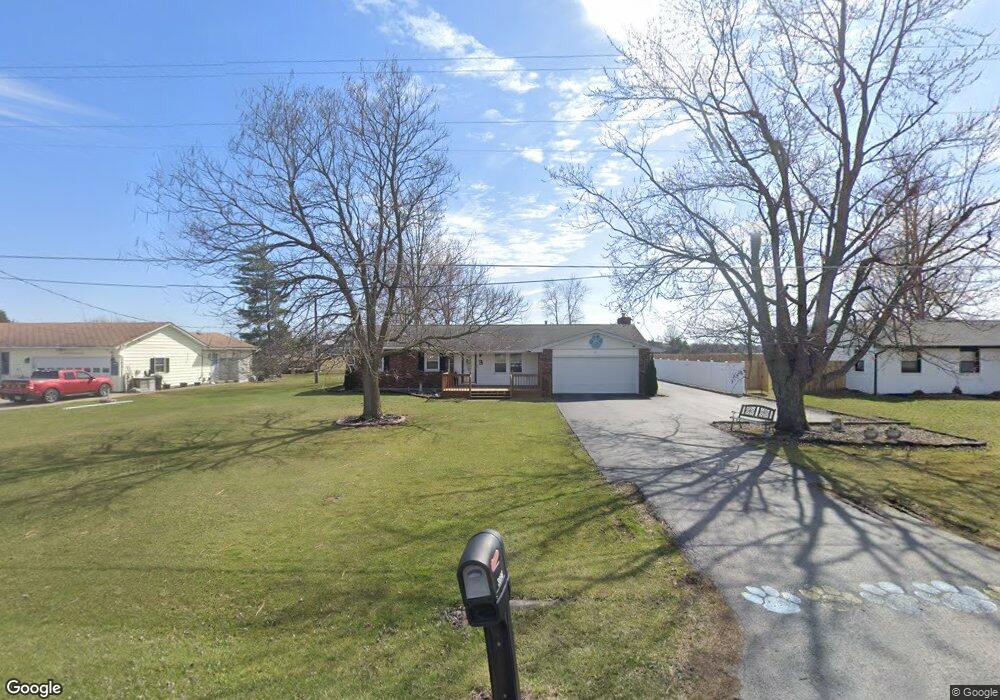
About This Home
This home is located at 3896 E Bluelick Rd, Lima, OH 45801 and is currently estimated at $220,228, approximately $161 per square foot. 3896 E Bluelick Rd is a home located in Allen County with nearby schools including Bath Elementary School, Bath Middle School, and Bath High School.
Ownership History
Date
Name
Owned For
Owner Type
Purchase Details
Closed on
Sep 21, 2006
Sold by
Crum Harold Roger and Crum Naomi Sue
Bought by
Bantner Eric J and Bantner Amanda M
Current Estimated Value
Home Financials for this Owner
Home Financials are based on the most recent Mortgage that was taken out on this home.
Original Mortgage
$95,000
Outstanding Balance
$51,722
Interest Rate
5.37%
Mortgage Type
Assumption
Estimated Equity
$168,506
Purchase Details
Closed on
Aug 8, 1997
Sold by
Sanchez Barney
Bought by
Crum Harold and Crum Naomi
Home Financials for this Owner
Home Financials are based on the most recent Mortgage that was taken out on this home.
Original Mortgage
$71,200
Interest Rate
7.68%
Mortgage Type
New Conventional
Purchase Details
Closed on
Jan 1, 1980
Bought by
Sanchez Barney Lancon
Create a Home Valuation Report for This Property
The Home Valuation Report is an in-depth analysis detailing your home's value as well as a comparison with similar homes in the area
Purchase History
| Date | Buyer | Sale Price | Title Company |
|---|---|---|---|
| Bantner Eric J | $115,000 | None Available | |
| Crum Harold | $89,000 | -- | |
| Sanchez Barney Lancon | -- | -- |
Source: Public Records
Mortgage History
| Date | Status | Borrower | Loan Amount |
|---|---|---|---|
| Open | Bantner Eric J | $95,000 | |
| Closed | Crum Harold | $71,200 |
Source: Public Records
Tax History
| Year | Tax Paid | Tax Assessment Tax Assessment Total Assessment is a certain percentage of the fair market value that is determined by local assessors to be the total taxable value of land and additions on the property. | Land | Improvement |
|---|---|---|---|---|
| 2024 | $2,461 | $56,150 | $6,410 | $49,740 |
| 2023 | $2,169 | $47,570 | $5,430 | $42,140 |
| 2022 | $2,158 | $47,570 | $5,430 | $42,140 |
| 2021 | $2,242 | $47,570 | $5,430 | $42,140 |
| 2020 | $1,998 | $38,470 | $5,220 | $33,250 |
| 2019 | $1,998 | $38,470 | $5,220 | $33,250 |
| 2018 | $1,952 | $38,470 | $5,220 | $33,250 |
| 2017 | $2,213 | $34,130 | $5,220 | $28,910 |
| 2016 | $2,100 | $34,130 | $5,220 | $28,910 |
| 2015 | $2,139 | $34,130 | $5,220 | $28,910 |
| 2014 | $2,139 | $33,540 | $5,220 | $28,320 |
| 2013 | $2,277 | $33,540 | $5,220 | $28,320 |
Source: Public Records
Map
Nearby Homes
- 0 N Dixie Hwy Unit 300253
- 2878 Autumn Lake Dr
- 3263 Shiloh Dr
- 2230 N Dixie Hwy
- 2145 N Dixie Hwy Unit 80
- 2145 N Dixie Hwy Unit 11
- 2145 N Dixie Hwy Unit 101
- 2145 N Dixie Hwy Unit 30
- 1656 Stewart Rd
- 6431 Couples Ln
- 5025 N Cool Rd
- 6476 Mickelson Ln
- 6477 Woods Dr Unit 220
- 1085 Lutz Rd
- 5817 N Dixie Hwy
- 115 Oakview Ct
- 5606 Reservoir Rd
- 1503 Findlay Rd Unit Lot 6
- 819 Canyon Dr
- 800 Heritage Dr
- 3920 E Bluelick Rd
- 3884 E Bluelick Rd
- 3866 E Bluelick Rd
- 3940 E Bluelick Rd
- 3844 E Bluelick Rd
- 3960 E Bluelick Rd
- 3822 E Bluelick Rd
- 3980 E Bluelick Rd
- 3800 E Bluelick Rd
- 4022 E Bluelick Rd
- 3782 E Bluelick Rd
- 4066 E Bluelick Rd
- 3768 E Bluelick Rd
- 3317 N Dixie Hwy
- 3355 N Dixie Hwy
- 3339 N Dixie Hwy
- 3387 N Dixie Hwy
- 3387 N Dixie Hwy
Your Personal Tour Guide
Ask me questions while you tour the home.