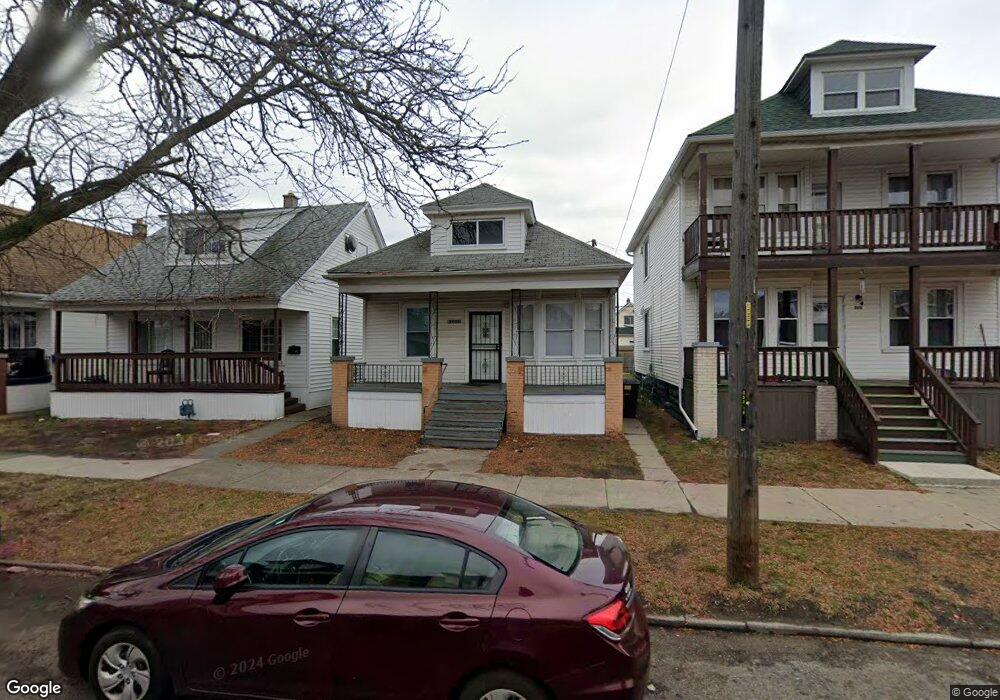
3899 Commor St HamtraMcK, MI 48212
Buffalo Charles NeighborhoodEstimated Value: $147,885 - $174,000
Studio
1
Bath
1,004
Sq Ft
$164/Sq Ft
Est. Value
About This Home
This home is located at 3899 Commor St, HamtraMcK, MI 48212 and is currently estimated at $164,221, approximately $163 per square foot. 3899 Commor St is a home located in Wayne County with nearby schools including Davison Elementary-Middle School, Charles L. Spain Elementary-Middle School, and Edward 'Duke' Ellington Conservatory of Music and Art.
Ownership History
Date
Name
Owned For
Owner Type
Purchase Details
Closed on
Sep 24, 2020
Sold by
Ali Latifa
Bought by
Yesmin Sabina
Current Estimated Value
Purchase Details
Closed on
Aug 18, 2015
Sold by
Kuras Janina
Bought by
Ali Latifa
Purchase Details
Closed on
Sep 14, 2005
Sold by
Tokarski Marek
Bought by
Kuras Janina
Purchase Details
Closed on
Oct 15, 2004
Sold by
Trela Mariusz
Bought by
Tokarski Marek
Purchase Details
Closed on
Jul 20, 2004
Sold by
Standard Federal Bank Na
Bought by
Trela Mariusz
Purchase Details
Closed on
Nov 26, 2003
Sold by
Nahorodny Daryl and Nahorodny Tammy M
Bought by
Standard Federal Bank Na
Create a Home Valuation Report for This Property
The Home Valuation Report is an in-depth analysis detailing your home's value as well as a comparison with similar homes in the area
Home Values in the Area
Average Home Value in this Area
Purchase History
| Date | Buyer | Sale Price | Title Company |
|---|---|---|---|
| Yesmin Sabina | -- | None Available | |
| Ali Latifa | $20,000 | Greco Title Agency Llc | |
| Kuras Janina | $43,500 | Blue Water Title | |
| Tokarski Marek | $24,800 | Chicago Title Insurance Comp | |
| Trela Mariusz | $20,000 | Greco | |
| Standard Federal Bank Na | $40,144 | -- |
Source: Public Records
Tax History
| Year | Tax Paid | Tax Assessment Tax Assessment Total Assessment is a certain percentage of the fair market value that is determined by local assessors to be the total taxable value of land and additions on the property. | Land | Improvement |
|---|---|---|---|---|
| 2025 | $867 | $38,500 | $0 | $0 |
| 2024 | $852 | $24,700 | $0 | $0 |
| 2023 | $826 | $20,000 | $0 | $0 |
| 2022 | $874 | $14,200 | $0 | $0 |
| 2021 | $1,085 | $10,400 | $0 | $0 |
| 2020 | $853 | $9,700 | $0 | $0 |
| 2019 | $841 | $7,900 | $0 | $0 |
| 2018 | $751 | $7,000 | $0 | $0 |
| 2017 | $123 | $6,500 | $0 | $0 |
| 2016 | $1,023 | $16,000 | $0 | $0 |
| 2015 | $1,040 | $10,400 | $0 | $0 |
| 2013 | $1,292 | $12,923 | $0 | $0 |
| 2010 | -- | $18,946 | $716 | $18,230 |
Source: Public Records
Map
Nearby Homes
- 3935 Caely St
- 11809 Conant St
- 5021 Talbot St
- 4994 Carpenter Ave
- 11711 Moran St
- 11697 Moran St
- 11651 Moran St
- 3875 Sobieski St
- 3837 Harold St
- 12099 Klinger St
- 11730 Sobieski St
- 4590 Charles St
- 12091 Sobieski St
- 12309 Klinger St
- 5092 Charles St
- 5201 Casmere St
- 3929 Caniff St
- 5574 Talbot St
- 5500 Talbot St
- 5518 Harold St
Your Personal Tour Guide
Ask me questions while you tour the home.