38B Wilbur St Worcester, MA 01606
Summit NeighborhoodEstimated Value: $473,070 - $517,000
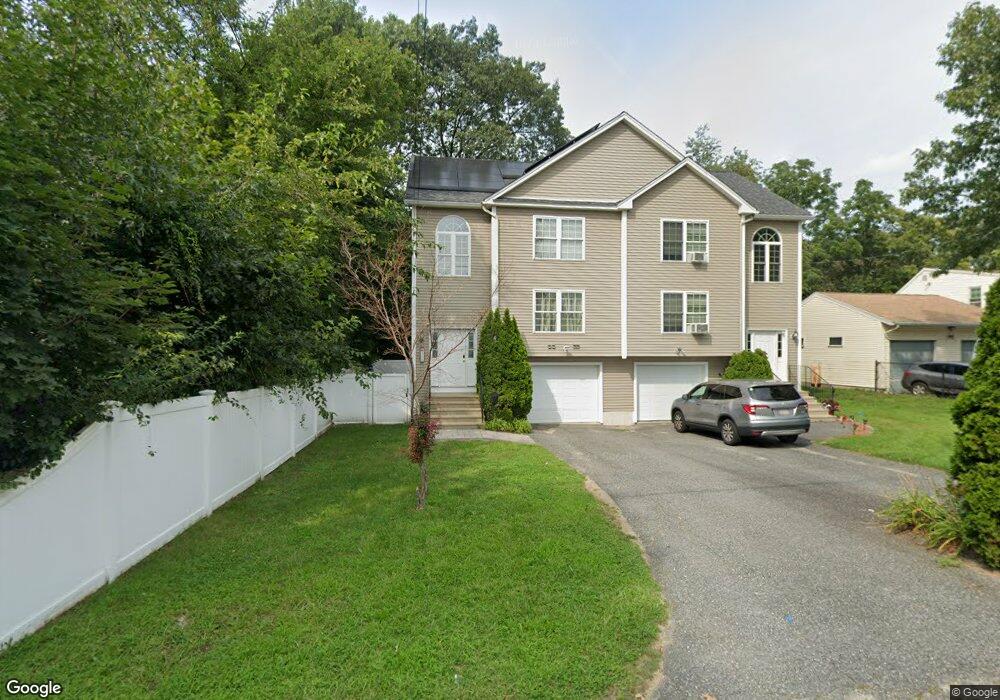
About This Home
This home is located at 38B Wilbur St, Worcester, MA 01606 and is currently estimated at $489,518, approximately $305 per square foot. 38B Wilbur St is a home located in Worcester County with nearby schools including Norrback Avenue Elementary School, Jacob Hiatt Magnet School, and Chandler Magnet.
Ownership History
We collect this data history from publicly available records. To have your information removed, we recommend requesting removal directly through your county’s website.
Purchase Details
Home Financials for this Owner
Home Financials are based on the most recent Mortgage that was taken out on this home.Purchase Details
Home Values in the Area
Average Home Value in this Area
Purchase History
We collect this data history from publicly available records. To have your information removed, we recommend requesting removal directly through your county’s website.
| Date | Buyer | Sale Price | Title Company |
|---|---|---|---|
| $370,000 | None Available | ||
| $249,900 | -- |
Mortgage History
We collect this data history from publicly available records. To have your information removed, we recommend requesting removal directly through your county’s website.
| Date | Status | Borrower | Loan Amount |
|---|---|---|---|
| Open | $363,298 | ||
| Previous Owner | $225,900 |
Tax History
We collect this data history from publicly available records. To have your information removed, we recommend requesting removal directly through your county’s website.
| Year | Tax Paid | Tax Assessment Tax Assessment Total Assessment is a certain percentage of the fair market value that is determined by local assessors to be the total taxable value of land and additions on the property. | Land | Improvement |
|---|---|---|---|---|
| 2025 | $5,399 | $409,300 | $83,900 | $325,400 |
| 2024 | $5,188 | $377,300 | $83,900 | $293,400 |
| 2023 | $4,987 | $347,800 | $72,900 | $274,900 |
| 2022 | $4,558 | $299,700 | $58,400 | $241,300 |
| 2021 | $4,418 | $271,400 | $46,700 | $224,700 |
| 2020 | $4,338 | $255,200 | $46,700 | $208,500 |
| 2019 | $4,349 | $241,600 | $42,000 | $199,600 |
| 2018 | $4,334 | $229,200 | $42,000 | $187,200 |
| 2017 | $4,088 | $212,700 | $42,000 | $170,700 |
| 2016 | $4,099 | $198,900 | $31,800 | $167,100 |
| 2015 | $3,992 | $198,900 | $31,800 | $167,100 |
| 2014 | $3,887 | $198,900 | $31,800 | $167,100 |
Map
- 18 Kennebec St
- 21 Arrowsic St
- 42 Castine St Unit 1
- 42 Castine St
- 7 Darrow St
- 149 Woodland St
- 6 Idalla Ave
- 670 Burncoat St Unit A
- 239 Woodland St Unit 3
- 87 Malden St
- 515 Prospect St
- 24 Maplewood Ave
- 17 Bonnie View Dr
- 17 Reynolds St
- 20 Highland Ave
- 156 Hillside Village Dr
- 328 Brooks St
- 17 Hunnewell Rd
- 91 Bunkerhill Pkwy
- 622 Shrewsbury St
- 39 Wilbur St
- 41 Wilbur St
- 41 Wilbur St Unit 41
- 16-d Kennebec St
- 16C Kennebec St
- 16D Kennebec St
- 16B Kennebec St
- 16 Kennebec St
- 16 Kennebec St Unit D
- 16 Kennebec St Unit C
- 16A Kennebec St
- 18A Kennebec St
- 18 Kennebec St Unit B
- 18 Kennebec St Unit A
- 37 Wilbur St
- 43 Wilbur St
- 40 Wilbur St
- 42 Wilbur St
- 18B Kennebec St
- 44 Wilbur St
Ask me questions while you tour the home.