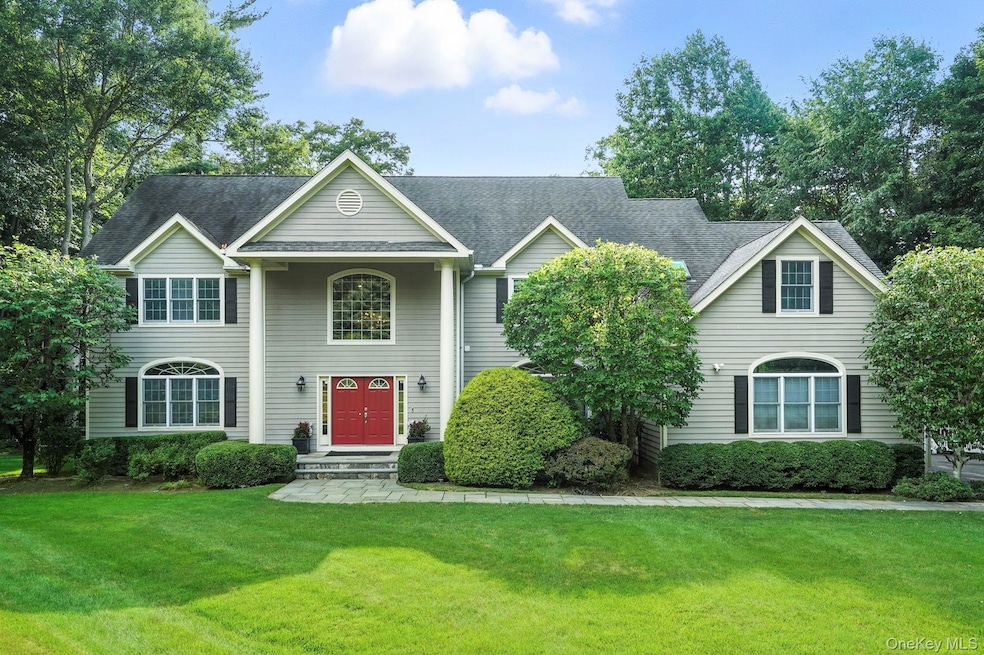

39 Admiral Wordens Ln Briarcliff Manor, NY 10510
Estimated payment $13,532/month
Highlights
- Eat-In Gourmet Kitchen
- Colonial Architecture
- Wood Flooring
- Todd Elementary School Rated A+
- Deck
- 1 Fireplace
About This Home
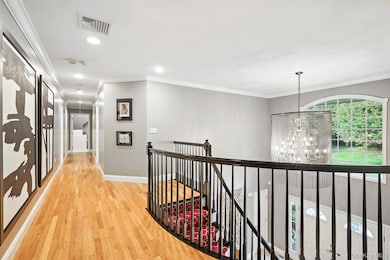
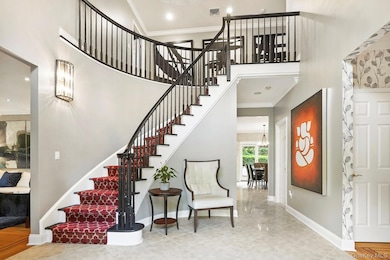
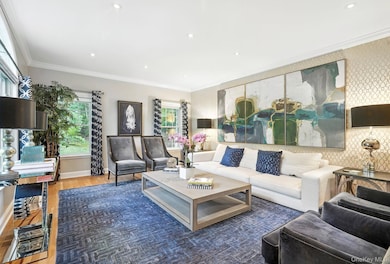
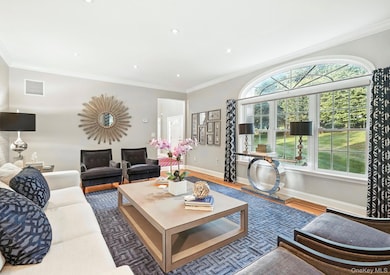
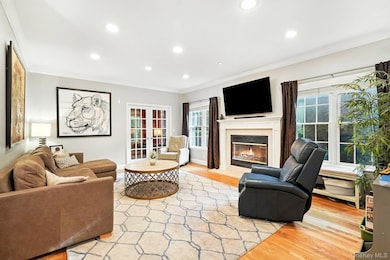
Elegant Colonial Living in the Heart of Briarcliff Manor. Experience the perfect balance of luxury, comfort, and convenience in this meticulously maintained Center Hall Colonial, ideally situated on 1.37 acres at the end of a quiet cul-de-sac in Briarcliff Manor. Designed for both everyday living and grand entertaining, this home offers refined details, modern updates, and a lifestyle that embraces all the best of Westchester living. A welcoming Belgian block lined driveway leads to a timeless residence where hardwood floors, soaring ceilings, and classic crown moldings set the tone. Gather around the wood-burning fireplace in the sun-filled family room or host memorable evenings in the beautifully updated kitchen featuring stainless steel appliances, quartz countertops, and a generous center island. Retreat to the serene primary suite, enhanced with a custom walk-in closet and spa like bath. Multiple home office options provide flexible space for today’s work-from-home lifestyle, while a convenient mudroom connects directly to the 3-car garage.
The CO'ed finished lower level offers endless possibilities with a private office, full bath, and recreation areas ideal for a home gym, media room, or guest suite. Outdoors, enjoy the fully fenced backyard for entertaining, gardening, or play.
Located minutes from the Scarborough MetroNorth station, village shopping, dining, and top-rated Briarcliff schools, this home is perfect for buyers seeking luxury living with easy commuting to New York City. Move right in and start enjoying the Briarcliff Manor lifestyle. Where elegance, space, and convenience come together.
Listing Agent
Houlihan Lawrence Inc. Brokerage Phone: 914-762-7200 License #30BR0445067 Listed on: 08/25/2025

Home Details
Home Type
- Single Family
Est. Annual Taxes
- $45,212
Year Built
- Built in 2000
Lot Details
- 1.37 Acre Lot
- Cul-De-Sac
- Back Yard Fenced
Parking
- 3 Car Garage
Home Design
- Colonial Architecture
- Split Level Home
- Frame Construction
Interior Spaces
- 4,500 Sq Ft Home
- Built-In Features
- Crown Molding
- High Ceiling
- 1 Fireplace
- Mud Room
- Entrance Foyer
- Family Room
- Formal Dining Room
- Finished Basement
- Walk-Out Basement
- Dryer
Kitchen
- Eat-In Gourmet Kitchen
- Gas Cooktop
- Dishwasher
- Stainless Steel Appliances
- Kitchen Island
Flooring
- Wood
- Tile
Bedrooms and Bathrooms
- 4 Bedrooms
- En-Suite Primary Bedroom
- Walk-In Closet
- Double Vanity
Outdoor Features
- Deck
- Basketball Hoop
Schools
- Todd Elementary School
- Briarcliff Middle School
- Briarcliff High School
Utilities
- Central Air
- Heating System Uses Natural Gas
- Underground Utilities
- Natural Gas Connected
- Cable TV Available
Listing and Financial Details
- Exclusions: Entry Chandelier, Dining Room Chandelier
- Assessor Parcel Number 4201-104-007-00000-000-0076-000-0-1
Map
Home Values in the Area
Average Home Value in this Area
Tax History
| Year | Tax Paid | Tax Assessment Tax Assessment Total Assessment is a certain percentage of the fair market value that is determined by local assessors to be the total taxable value of land and additions on the property. | Land | Improvement |
|---|---|---|---|---|
| 2024 | $43,736 | $1,604,100 | $454,200 | $1,149,900 |
| 2023 | $42,511 | $1,489,500 | $454,200 | $1,035,300 |
| 2022 | $39,598 | $1,387,700 | $454,200 | $933,500 |
| 2021 | $38,335 | $1,273,100 | $454,200 | $818,900 |
| 2020 | $36,816 | $1,273,100 | $454,200 | $818,900 |
| 2019 | $37,130 | $1,217,700 | $511,000 | $706,700 |
| 2018 | $42,699 | $1,217,700 | $511,000 | $706,700 |
| 2017 | $23,524 | $1,194,300 | $511,000 | $683,300 |
| 2016 | $437,103 | $1,170,900 | $511,000 | $659,900 |
| 2015 | $26,911 | $60,000 | $15,000 | $45,000 |
| 2014 | $26,911 | $60,000 | $15,000 | $45,000 |
| 2013 | $26,911 | $60,000 | $15,000 | $45,000 |
Property History
| Date | Event | Price | List to Sale | Price per Sq Ft |
|---|---|---|---|---|
| 10/10/2025 10/10/25 | Pending | -- | -- | -- |
| 08/25/2025 08/25/25 | For Sale | $1,849,000 | -- | $411 / Sq Ft |
Purchase History
| Date | Type | Sale Price | Title Company |
|---|---|---|---|
| Bargain Sale Deed | $1,080,000 | Thoroughbred Title Svcs Llc | |
| Bargain Sale Deed | $739,900 | -- |
Mortgage History
| Date | Status | Loan Amount | Loan Type |
|---|---|---|---|
| Open | $864,000 | New Conventional | |
| Previous Owner | $150,000 | Adjustable Rate Mortgage/ARM |
Source: OneKey® MLS
MLS Number: 895038
APN: 4201-104-007-00000-000-0076-000-0-1
Disclaimer: Certain information contained herein is derived from information provided by parties other than Homes.com. All information provided is deemed reliable, but is not guaranteed to be accurate and should be independently verified.
![]() The data relating to real estate for sale or lease on this web site comes in part from OneKey® MLS. Real estate listings held by brokerage firms other than Ten-X are marked with the OneKey® MLS logo or an abbreviated logo and detailed information about them includes the name of the listing broker.
The data relating to real estate for sale or lease on this web site comes in part from OneKey® MLS. Real estate listings held by brokerage firms other than Ten-X are marked with the OneKey® MLS logo or an abbreviated logo and detailed information about them includes the name of the listing broker.
IDX information is provided exclusively for personal, non-commercial use, and may not be used for any purpose other than to identify prospective properties consumers may be interested in purchasing.
Information is deemed reliable but not guaranteed.
Copyright 2025 OneKey® MLS. All rights reserved.
- 36 Revolutionary Rd
- 2 Creighton Ln
- 155 Revolutionary Rd
- 12 Country Club Ln N
- 608 Kemeys Cove Unit 6-08
- 24 Country Club Ln
- 10 Briarbrook Dr
- 70 Briarbrook Dr
- 16 Rockledge Ave Unit 7J
- 16 Rockledge Ave Unit 5B1
- 16 Rockledge Ave Unit 3E1
- 16 Rockledge Ave Unit 5L2
- 2 Requa St
- 23 Liberty St
- 7 Liberty St
- 147 Charter Cir Unit 147
- 842 Sleepy Hollow Rd
- 97 Charter Cir Unit 97
- 84 Charter Cir Unit 84
- 1 Agate Ave