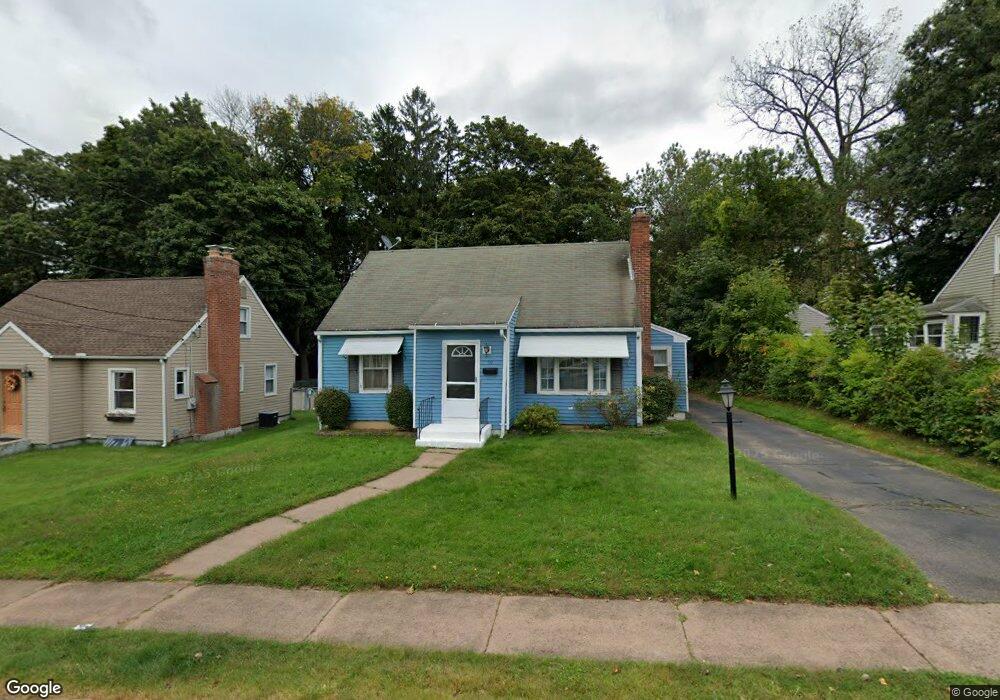
39 Ardmore Rd Manchester, CT 06040
Center NeighborhoodEstimated Value: $305,598 - $333,000
3
Beds
1
Bath
1,406
Sq Ft
$228/Sq Ft
Est. Value
About This Home
This home is located at 39 Ardmore Rd, Manchester, CT 06040 and is currently estimated at $320,650, approximately $228 per square foot. 39 Ardmore Rd is a home located in Hartford County with nearby schools including Bowers School, Illing Middle School, and Elisabeth M. Bennet Academy.
Ownership History
Date
Name
Owned For
Owner Type
Purchase Details
Closed on
Jul 6, 2007
Sold by
Burdett Jason E and Burdett Jellian M
Bought by
Calpa Servio T
Current Estimated Value
Home Financials for this Owner
Home Financials are based on the most recent Mortgage that was taken out on this home.
Original Mortgage
$210,000
Outstanding Balance
$130,501
Interest Rate
6.39%
Estimated Equity
$190,149
Purchase Details
Closed on
Jun 10, 2005
Sold by
Wilson Jennifer and Wilson Rodney S
Bought by
Burdett Jason E and Burdett Jillian M
Purchase Details
Closed on
Nov 1, 2000
Sold by
Baniszewski Robert J and Baniszewski Mary J
Bought by
Wilson Rodney S and Wilson Jennifer
Purchase Details
Closed on
Jan 16, 1991
Sold by
Wallace Carmella C
Bought by
Baniszewski Robert J and Baniszewski Mary J
Create a Home Valuation Report for This Property
The Home Valuation Report is an in-depth analysis detailing your home's value as well as a comparison with similar homes in the area
Home Values in the Area
Average Home Value in this Area
Purchase History
| Date | Buyer | Sale Price | Title Company |
|---|---|---|---|
| Calpa Servio T | $210,000 | -- | |
| Calpa Servio T | $210,000 | -- | |
| Burdett Jason E | $183,000 | -- | |
| Burdett Jason E | $183,000 | -- | |
| Wilson Rodney S | $143,900 | -- | |
| Wilson Rodney S | $143,900 | -- | |
| Baniszewski Robert J | $134,000 | -- |
Source: Public Records
Mortgage History
| Date | Status | Borrower | Loan Amount |
|---|---|---|---|
| Open | Baniszewski Robert J | $210,000 | |
| Closed | Baniszewski Robert J | $210,000 |
Source: Public Records
Tax History Compared to Growth
Tax History
| Year | Tax Paid | Tax Assessment Tax Assessment Total Assessment is a certain percentage of the fair market value that is determined by local assessors to be the total taxable value of land and additions on the property. | Land | Improvement |
|---|---|---|---|---|
| 2025 | $5,296 | $133,000 | $36,700 | $96,300 |
| 2024 | $5,144 | $133,000 | $36,700 | $96,300 |
| 2023 | $4,948 | $133,000 | $36,700 | $96,300 |
| 2022 | $4,804 | $133,000 | $36,700 | $96,300 |
| 2021 | $4,289 | $102,300 | $31,500 | $70,800 |
| 2020 | $4,283 | $102,300 | $31,500 | $70,800 |
| 2019 | $4,266 | $102,300 | $31,500 | $70,800 |
| 2018 | $4,185 | $102,300 | $31,500 | $70,800 |
| 2017 | $4,066 | $102,300 | $31,500 | $70,800 |
| 2016 | $4,361 | $109,900 | $40,500 | $69,400 |
| 2015 | $4,330 | $109,900 | $40,500 | $69,400 |
| 2014 | $4,248 | $109,900 | $40,500 | $69,400 |
Source: Public Records
Map
Nearby Homes