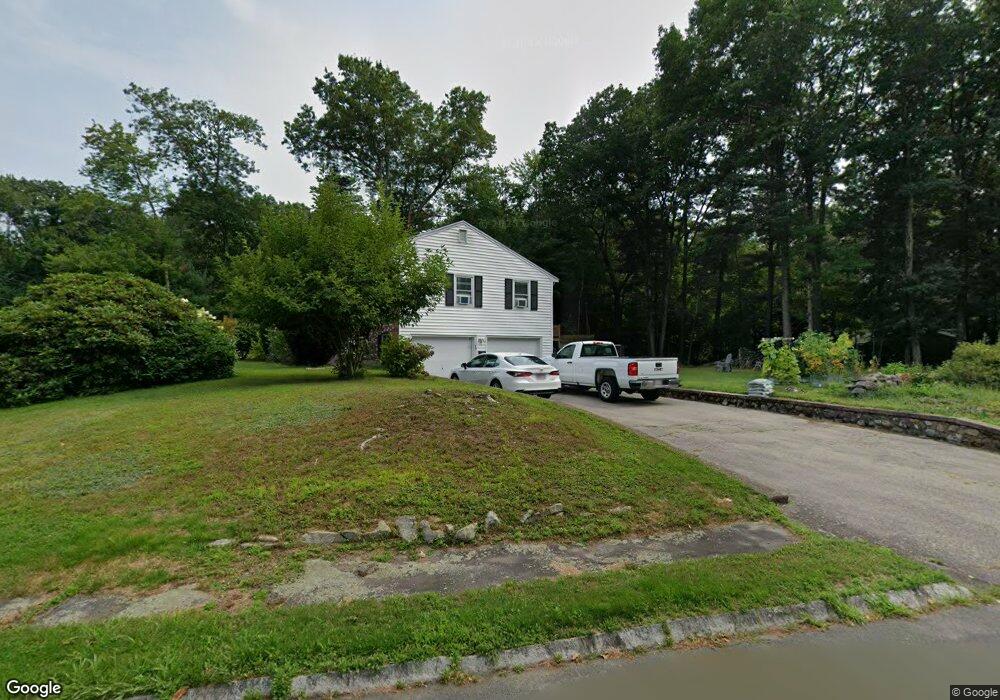
39 Barton Rd Foxboro, MA 02035
Estimated Value: $663,127 - $700,000
3
Beds
2
Baths
1,366
Sq Ft
$501/Sq Ft
Est. Value
About This Home
This home is located at 39 Barton Rd, Foxboro, MA 02035 and is currently estimated at $684,032, approximately $500 per square foot. 39 Barton Rd is a home located in Norfolk County with nearby schools including Foxborough High School, Hands-On-Montessori School, and Cadence Academy Preschool - North Attleborough.
Ownership History
Date
Name
Owned For
Owner Type
Purchase Details
Closed on
Nov 17, 2000
Sold by
Barry Mary J
Bought by
Slack Kathleen M and Slack Bradford L
Current Estimated Value
Home Financials for this Owner
Home Financials are based on the most recent Mortgage that was taken out on this home.
Original Mortgage
$195,600
Outstanding Balance
$71,560
Interest Rate
7.78%
Mortgage Type
Purchase Money Mortgage
Estimated Equity
$612,472
Purchase Details
Closed on
Jul 31, 1991
Sold by
Spinelli Donald R and Spinelli Debra L
Bought by
Lydon Mary J
Create a Home Valuation Report for This Property
The Home Valuation Report is an in-depth analysis detailing your home's value as well as a comparison with similar homes in the area
Home Values in the Area
Average Home Value in this Area
Purchase History
| Date | Buyer | Sale Price | Title Company |
|---|---|---|---|
| Slack Kathleen M | $244,500 | -- | |
| Lydon Mary J | $168,000 | -- |
Source: Public Records
Mortgage History
| Date | Status | Borrower | Loan Amount |
|---|---|---|---|
| Open | Lydon Mary J | $195,600 | |
| Previous Owner | Lydon Mary J | $60,000 |
Source: Public Records
Tax History Compared to Growth
Tax History
| Year | Tax Paid | Tax Assessment Tax Assessment Total Assessment is a certain percentage of the fair market value that is determined by local assessors to be the total taxable value of land and additions on the property. | Land | Improvement |
|---|---|---|---|---|
| 2025 | $7,212 | $545,500 | $247,300 | $298,200 |
| 2024 | $6,912 | $511,600 | $251,800 | $259,800 |
| 2023 | $6,684 | $470,400 | $239,800 | $230,600 |
| 2022 | $6,074 | $418,300 | $201,000 | $217,300 |
| 2021 | $5,662 | $384,100 | $186,100 | $198,000 |
| 2020 | $5,274 | $362,000 | $186,100 | $175,900 |
| 2019 | $5,145 | $350,000 | $177,300 | $172,700 |
| 2018 | $5,008 | $343,700 | $177,300 | $166,400 |
| 2017 | $5,023 | $334,000 | $165,700 | $168,300 |
| 2016 | $5,095 | $343,800 | $167,100 | $176,700 |
| 2015 | $4,881 | $321,300 | $141,300 | $180,000 |
| 2014 | $4,678 | $312,100 | $132,100 | $180,000 |
Source: Public Records
Map
Nearby Homes
- 406 South St
- 24 Maverick Dr
- 16 Treasure Island Rd
- 4 Buckskin Dr
- 450 West St
- 80 Mill St
- 9 Oak Dr
- 150 Gilbert St
- 116 George St
- 356 Central St
- 231 Spring St
- 166 Chauncy St
- 12 Spring St
- 11 Landry Ave
- 28 Messenger St
- 196 Donald Tennant Cir
- 126 Washington St
- 130 Washington St
- 124 Washington St
- 158 Washington St