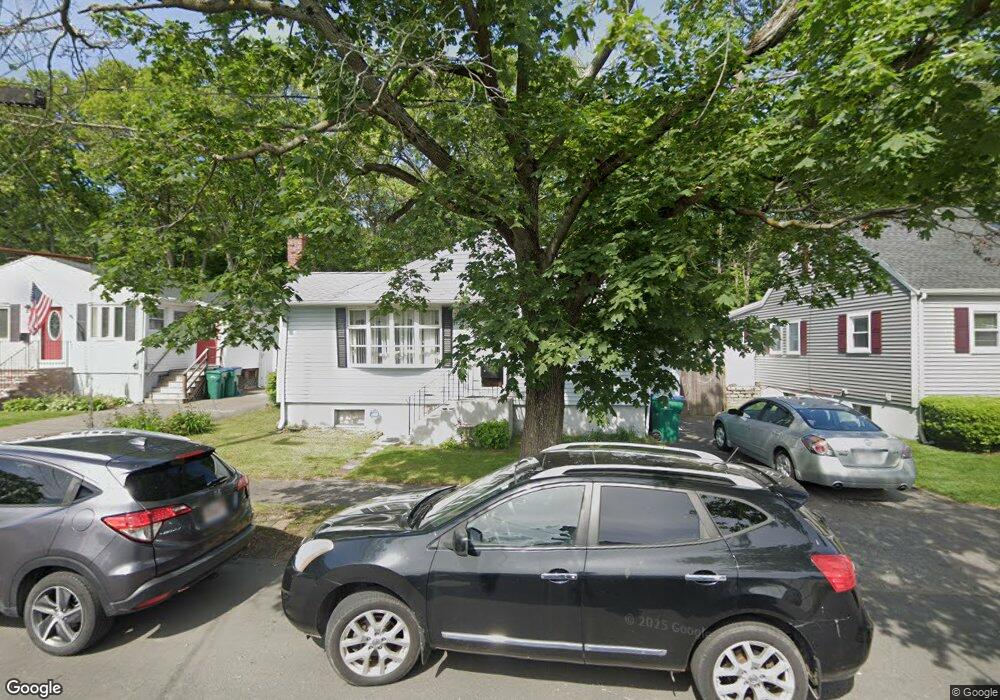
39 Basse Rd Lynn, MA 01905
Parkland Avenue NeighborhoodEstimated Value: $558,000 - $590,051
3
Beds
1
Bath
1,152
Sq Ft
$502/Sq Ft
Est. Value
About This Home
This home is located at 39 Basse Rd, Lynn, MA 01905 and is currently estimated at $578,013, approximately $501 per square foot. 39 Basse Rd is a home located in Essex County with nearby schools including Sewell-Anderson Elementary School, William R. Fallon School, and Breed Middle School.
Ownership History
Date
Name
Owned For
Owner Type
Purchase Details
Closed on
Mar 28, 2016
Sold by
Troy Julie E
Bought by
Julie Ellen Troy Ft and Troy
Current Estimated Value
Purchase Details
Closed on
Mar 26, 2004
Sold by
Leblanc Irene P
Bought by
Troy Julie E
Purchase Details
Closed on
Oct 14, 2003
Sold by
Homan Phyllis M and Leblanc Thomas A
Bought by
Leblanc Irene P
Create a Home Valuation Report for This Property
The Home Valuation Report is an in-depth analysis detailing your home's value as well as a comparison with similar homes in the area
Home Values in the Area
Average Home Value in this Area
Purchase History
| Date | Buyer | Sale Price | Title Company |
|---|---|---|---|
| Julie Ellen Troy Ft | -- | -- | |
| Julie Ellen Troy Ft | -- | -- | |
| Troy Julie E | $270,000 | -- | |
| Troy Julie E | $270,000 | -- | |
| Leblanc Irene P | -- | -- | |
| Leblanc Irene P | -- | -- |
Source: Public Records
Mortgage History
| Date | Status | Borrower | Loan Amount |
|---|---|---|---|
| Previous Owner | Leblanc Irene P | $184,000 | |
| Previous Owner | Leblanc Irene P | $192,000 |
Source: Public Records
Tax History
| Year | Tax Paid | Tax Assessment Tax Assessment Total Assessment is a certain percentage of the fair market value that is determined by local assessors to be the total taxable value of land and additions on the property. | Land | Improvement |
|---|---|---|---|---|
| 2025 | $5,313 | $512,800 | $199,900 | $312,900 |
| 2024 | $5,001 | $474,900 | $190,200 | $284,700 |
| 2023 | $5,064 | $454,200 | $200,700 | $253,500 |
| 2022 | $4,670 | $375,700 | $159,500 | $216,200 |
| 2021 | $4,396 | $337,400 | $139,300 | $198,100 |
| 2020 | $4,293 | $320,400 | $128,300 | $192,100 |
| 2019 | $4,360 | $304,900 | $127,300 | $177,600 |
| 2018 | $4,395 | $290,100 | $134,200 | $155,900 |
| 2017 | $4,150 | $266,000 | $116,700 | $149,300 |
| 2016 | $4,005 | $247,500 | $110,700 | $136,800 |
| 2015 | $3,995 | $238,500 | $116,700 | $121,800 |
Source: Public Records
Map
Nearby Homes
- 5 Floyd Ave
- 1 Hillcrest Ave
- 354 Broadway Unit 3
- 52 Savory St
- 100 Magnolia Ave Unit 5
- 175 Jenness St
- 103 Kernwood Dr
- 99 New Park St
- 2 Chestnut Terrace
- 10 Pond St
- 11 Urban St
- 268 Walnut St
- 25 Bulfinch St
- 198 Locust St Unit 303
- 200 Locust St Unit 706
- 9 Sutcliffe Rd
- 274 Boston St
- 16 Ferris Rd
- 50-50A Kirtland St
- 75 Park Rd
Your Personal Tour Guide
Ask me questions while you tour the home.