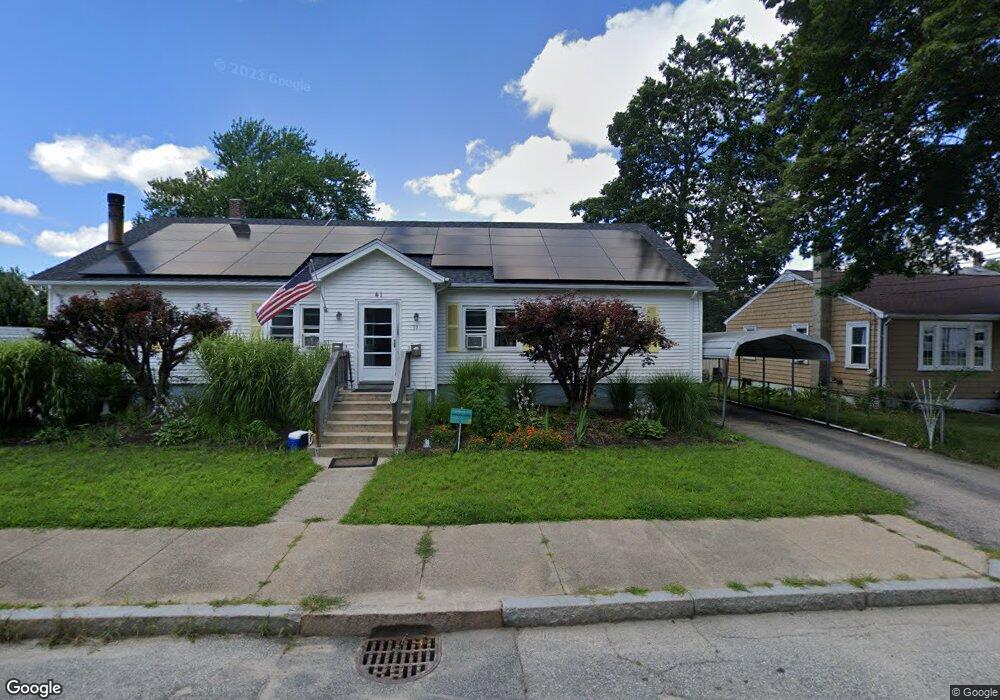
39 Beech St Unit 41 Woonsocket, RI 02895
Globe District NeighborhoodEstimated Value: $553,313 - $595,000
7
Beds
5
Baths
3,119
Sq Ft
$185/Sq Ft
Est. Value
About This Home
This home is located at 39 Beech St Unit 41, Woonsocket, RI 02895 and is currently estimated at $576,578, approximately $184 per square foot. 39 Beech St Unit 41 is a home located in Providence County with nearby schools including Woonsocket High School, Rise Prep Mayoral Academy Middle School, and Rise Prep Mayoral Academy.
Ownership History
Date
Name
Owned For
Owner Type
Purchase Details
Closed on
Sep 23, 2020
Sold by
Montecalvo Dawn M
Bought by
Montecalvo Dawn M
Current Estimated Value
Home Financials for this Owner
Home Financials are based on the most recent Mortgage that was taken out on this home.
Original Mortgage
$234,000
Outstanding Balance
$205,764
Interest Rate
2.9%
Mortgage Type
New Conventional
Estimated Equity
$370,814
Purchase Details
Closed on
Jan 22, 2007
Sold by
Delaurier Claudette
Bought by
Montecalvo Dawn M and Delaurier Jason M
Home Financials for this Owner
Home Financials are based on the most recent Mortgage that was taken out on this home.
Original Mortgage
$285,000
Interest Rate
6.14%
Mortgage Type
Purchase Money Mortgage
Create a Home Valuation Report for This Property
The Home Valuation Report is an in-depth analysis detailing your home's value as well as a comparison with similar homes in the area
Home Values in the Area
Average Home Value in this Area
Purchase History
| Date | Buyer | Sale Price | Title Company |
|---|---|---|---|
| Montecalvo Dawn M | -- | None Available | |
| Montecalvo Dawn M | -- | None Available | |
| Montecalvo Dawn M | -- | None Available | |
| Montecalvo Dawn M | -- | None Available | |
| Montecalvo Dawn M | $360,000 | -- | |
| Montecalvo Dawn M | $360,000 | -- |
Source: Public Records
Mortgage History
| Date | Status | Borrower | Loan Amount |
|---|---|---|---|
| Open | Montecalvo Dawn M | $234,000 | |
| Closed | Montecalvo Dawn M | $234,000 | |
| Previous Owner | Montecalvo Dawn M | $285,000 |
Source: Public Records
Tax History
| Year | Tax Paid | Tax Assessment Tax Assessment Total Assessment is a certain percentage of the fair market value that is determined by local assessors to be the total taxable value of land and additions on the property. | Land | Improvement |
|---|---|---|---|---|
| 2025 | $6,042 | $538,000 | $107,800 | $430,200 |
| 2024 | $5,617 | $386,300 | $95,600 | $290,700 |
| 2023 | $5,400 | $386,300 | $95,600 | $290,700 |
| 2022 | $5,400 | $386,300 | $95,600 | $290,700 |
| 2021 | $4,263 | $179,500 | $60,000 | $119,500 |
| 2020 | $4,308 | $179,500 | $60,000 | $119,500 |
| 2018 | $4,322 | $179,500 | $60,000 | $119,500 |
| 2017 | $5,620 | $186,700 | $46,900 | $139,800 |
| 2016 | $5,945 | $186,700 | $46,900 | $139,800 |
| 2015 | $6,829 | $186,700 | $46,900 | $139,800 |
| 2014 | $6,735 | $187,400 | $51,700 | $135,700 |
Source: Public Records
Map
Nearby Homes
- 184 Avenue C Unit 2
- 184 Avenue C Unit 5
- 184 Avenue C Unit 6
- 184 Avenue C Unit 3
- 184 Avenue C Unit 4
- 184 Avenue C Unit 1
- 43 Summit St
- 190 Coe St
- 1 Admiral St
- 84 Bernice Ave
- 435 S Main St
- 103 Elmore Ave
- 34 Smithfield Rd
- 41 Summit Ave
- 42 Transit St
- 65 Milton Ave
- 0 Holbrook Ln Unit 1402850
- 122 Grand St
- 109 Hemond Ave
- 136 Hemond Ave
Your Personal Tour Guide
Ask me questions while you tour the home.