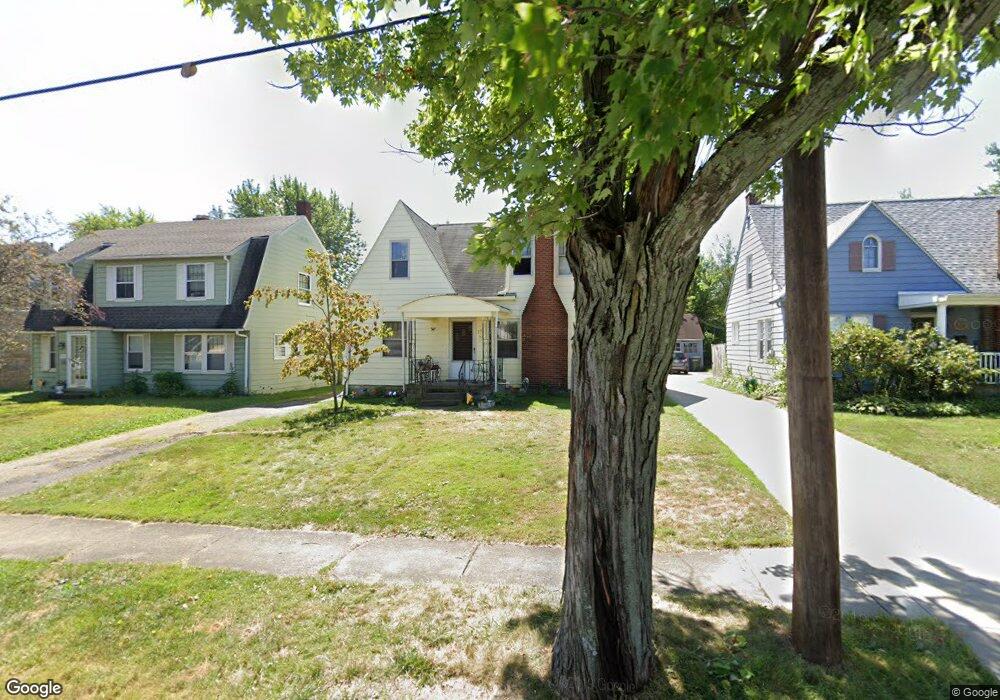
39 Beechwood Dr Youngstown, OH 44512
Estimated Value: $112,000 - $122,958
3
Beds
2
Baths
1,645
Sq Ft
$71/Sq Ft
Est. Value
About This Home
This home is located at 39 Beechwood Dr, Youngstown, OH 44512 and is currently estimated at $116,490, approximately $70 per square foot. 39 Beechwood Dr is a home located in Mahoning County with nearby schools including Boardman Glenwood Junior High School, Boardman High School, and Horizon Science Academy - Youngstown.
Ownership History
Date
Name
Owned For
Owner Type
Purchase Details
Closed on
Jun 26, 2015
Sold by
Blackstone Real Estate Llc
Bought by
Jones Ii Gregory
Current Estimated Value
Purchase Details
Closed on
Oct 5, 2009
Sold by
Blackstone Real Estate Llc
Bought by
Zou Min
Purchase Details
Closed on
Mar 24, 2009
Sold by
Ib Property Holdings Llc
Bought by
Blackstone Real Estate Llc
Purchase Details
Closed on
Sep 25, 2008
Sold by
Oliver Roy N and Oliver Sandra A
Bought by
Ib Property Holdings Llc
Purchase Details
Closed on
Aug 8, 1996
Sold by
Lininger Alan K
Bought by
Farrell Albert K
Home Financials for this Owner
Home Financials are based on the most recent Mortgage that was taken out on this home.
Original Mortgage
$47,700
Interest Rate
8.33%
Mortgage Type
New Conventional
Purchase Details
Closed on
Jul 16, 1991
Bought by
Lininger Alan K
Create a Home Valuation Report for This Property
The Home Valuation Report is an in-depth analysis detailing your home's value as well as a comparison with similar homes in the area
Home Values in the Area
Average Home Value in this Area
Purchase History
| Date | Buyer | Sale Price | Title Company |
|---|---|---|---|
| Jones Ii Gregory | $12,500 | Attorney | |
| Zou Min | $23,000 | Attorney | |
| Blackstone Real Estate Llc | $10,000 | None Available | |
| Ib Property Holdings Llc | $48,000 | None Available | |
| Farrell Albert K | $53,000 | -- | |
| Lininger Alan K | -- | -- |
Source: Public Records
Mortgage History
| Date | Status | Borrower | Loan Amount |
|---|---|---|---|
| Previous Owner | Farrell Albert K | $47,700 |
Source: Public Records
Tax History Compared to Growth
Tax History
| Year | Tax Paid | Tax Assessment Tax Assessment Total Assessment is a certain percentage of the fair market value that is determined by local assessors to be the total taxable value of land and additions on the property. | Land | Improvement |
|---|---|---|---|---|
| 2024 | $2,494 | $26,380 | $3,240 | $23,140 |
| 2023 | $1,366 | $26,380 | $3,240 | $23,140 |
| 2022 | $794 | $11,520 | $3,210 | $8,310 |
| 2021 | $795 | $11,520 | $3,210 | $8,310 |
| 2020 | $799 | $11,520 | $3,210 | $8,310 |
| 2019 | $815 | $10,190 | $2,840 | $7,350 |
| 2018 | $1,464 | $10,190 | $2,840 | $7,350 |
| 2017 | $965 | $10,190 | $2,840 | $7,350 |
| 2016 | $639 | $7,410 | $3,080 | $4,330 |
| 2015 | $958 | $8,320 | $3,080 | $5,240 |
| 2014 | $820 | $8,320 | $3,080 | $5,240 |
| 2013 | $920 | $8,320 | $3,080 | $5,240 |
Source: Public Records
Map
Nearby Homes
- 28 Terrace Dr
- 60 Shadyside Dr
- 83 Beechwood Dr
- 94 Beechwood Dr
- 94 Shadyside Dr
- 4508 Southern Blvd
- 4504 Southern Blvd
- 30 Pinehurst Ave
- 148 Clifton Dr
- 4312 Helena Ave
- 4307 Helena Ave
- 175 Homestead Dr
- 4250 Oak Knoll Dr
- 4144 Helena Ave
- 117 Overhill Rd
- 81 Melrose Ave
- 127 Melrose Ave
- 4225 Stratford Rd
- 4141 Windsor Rd
- 204 Lowell Ave
- 35 Beechwood Dr
- 41 Beechwood Dr
- 31 Beechwood Dr
- 43 Beechwood Dr
- 40 Clifton Dr
- 46 Clifton Dr
- 38 Clifton Dr
- 51 Beechwood Dr
- 29 Beechwood Dr
- 48 Clifton Dr
- 34 Clifton Dr
- 40 Beechwood Dr
- 42 Beechwood Dr
- 38 Beechwood Dr
- 50 Clifton Dr
- 27 Beechwood Dr
- 53 Beechwood Dr
- 30 Clifton Dr
- 46 Beechwood Dr
- 34 Beechwood Dr