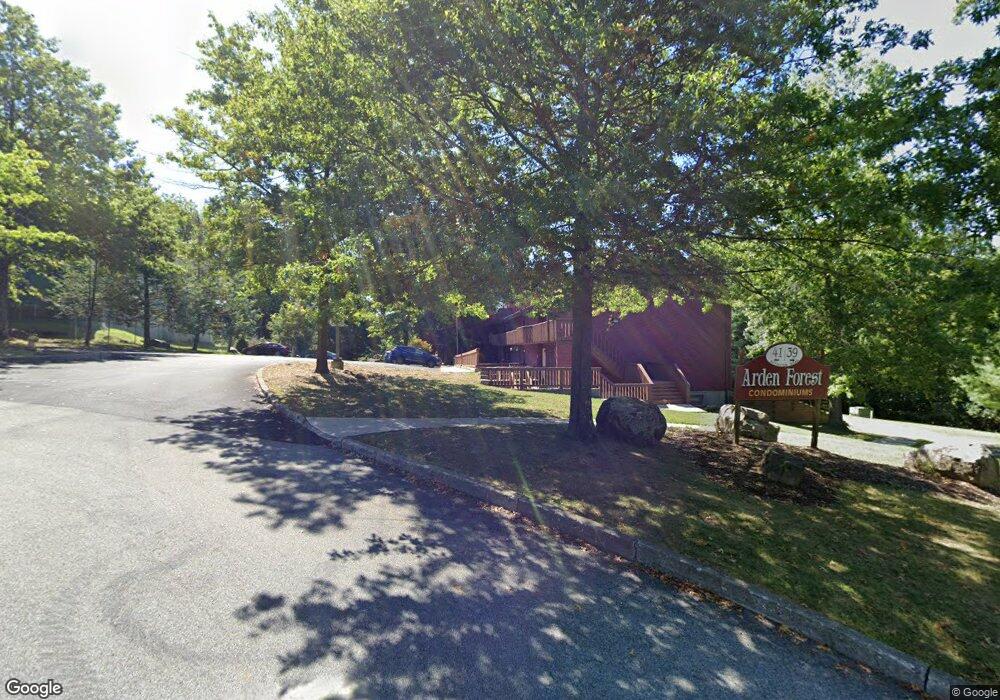
39 Berwynn Rd Unit 1A Harriman, NY 10926
Estimated Value: $241,000 - $279,855
2
Beds
2
Baths
960
Sq Ft
$274/Sq Ft
Est. Value
About This Home
This home is located at 39 Berwynn Rd Unit 1A, Harriman, NY 10926 and is currently estimated at $262,714, approximately $273 per square foot. 39 Berwynn Rd Unit 1A is a home located in Orange County with nearby schools including Monroe-Woodbury Middle School, Monroe-Woodbury High School, and St. Paul Christian Education Center.
Ownership History
Date
Name
Owned For
Owner Type
Purchase Details
Closed on
Sep 5, 2024
Sold by
Calvano Amy
Bought by
Labolitta Anthony
Current Estimated Value
Purchase Details
Closed on
Aug 12, 2016
Sold by
Reynolds Kristine A
Bought by
Calvano Amy
Purchase Details
Closed on
Dec 29, 2004
Sold by
Reyes Juliane
Bought by
Suback Kristine A
Purchase Details
Closed on
Jun 25, 2003
Sold by
Byrne Linda
Bought by
Reyes Juliane
Purchase Details
Closed on
Jan 3, 2002
Sold by
Macchiarulo Carl and Macchiarulo Kelli
Bought by
Byrne Stephen
Home Financials for this Owner
Home Financials are based on the most recent Mortgage that was taken out on this home.
Original Mortgage
$79,100
Interest Rate
6.85%
Mortgage Type
FHA
Purchase Details
Closed on
Sep 11, 2000
Sold by
Lemond Richard and Lemond Linda
Bought by
Macchiarulo Carl and Macchiarulo Kelli
Create a Home Valuation Report for This Property
The Home Valuation Report is an in-depth analysis detailing your home's value as well as a comparison with similar homes in the area
Home Values in the Area
Average Home Value in this Area
Purchase History
| Date | Buyer | Sale Price | Title Company |
|---|---|---|---|
| Labolitta Anthony | $280,000 | None Available | |
| Labolitta Anthony | $280,000 | None Available | |
| Calvano Amy | $140,000 | Lisa Felicissimo | |
| Calvano Amy | $140,000 | Lisa Felicissimo | |
| Suback Kristine A | $181,000 | J Bennett Farrell | |
| Suback Kristine A | $181,000 | J Bennett Farrell | |
| Reyes Juliane | $97,155 | Gary Goldstein | |
| Reyes Juliane | $97,155 | Gary Goldstein | |
| Byrne Stephen | $89,250 | -- | |
| Byrne Stephen | $89,250 | -- | |
| Macchiarulo Carl | $81,000 | -- | |
| Macchiarulo Carl | $81,000 | -- |
Source: Public Records
Mortgage History
| Date | Status | Borrower | Loan Amount |
|---|---|---|---|
| Previous Owner | Byrne Stephen | $79,100 |
Source: Public Records
Tax History Compared to Growth
Tax History
| Year | Tax Paid | Tax Assessment Tax Assessment Total Assessment is a certain percentage of the fair market value that is determined by local assessors to be the total taxable value of land and additions on the property. | Land | Improvement |
|---|---|---|---|---|
| 2024 | $4,212 | $22,100 | $8,800 | $13,300 |
| 2023 | $4,151 | $22,100 | $8,800 | $13,300 |
| 2022 | $4,005 | $22,100 | $8,800 | $13,300 |
| 2021 | $4,025 | $22,100 | $8,800 | $13,300 |
| 2020 | $3,975 | $22,100 | $8,800 | $13,300 |
| 2019 | $3,917 | $22,100 | $8,800 | $13,300 |
| 2018 | $3,917 | $22,100 | $8,800 | $13,300 |
| 2017 | $3,856 | $22,100 | $8,800 | $13,300 |
| 2016 | $3,868 | $22,100 | $8,800 | $13,300 |
| 2015 | -- | $22,100 | $8,800 | $13,300 |
| 2014 | -- | $22,100 | $8,800 | $13,300 |
Source: Public Records
Map
Nearby Homes
- 314 Harriman Heights Rd
- 46 Woodland Rd
- 229 Orchard Dr
- 17 Arlington Dr
- 9 Woodland Rd
- 254 Orchard Dr
- 86 Talbot Rd
- 2 Fawn Ridge Ct
- 26 Lexington Hill Unit 1
- 12 Edgewood Dr
- 34 Clark Ln
- 4 Makan Rd
- 8 Lexington Hills Rd Unit 6
- 8 Heritage Dr Unit A
- 5 Lexington Hill Unit 3
- 5 Heritage Dr Unit D
- 5 Heritage Dr Unit C
- 9 Heritage Dr Unit B
- 1 Heritage Dr Unit 1 H
- 108 Circle Dr
- 39 Berwynn Rd Unit B2
- 39 Berwynn Rd Unit A4
- 39 Berwynn Rd Unit A8
- 39 Berwynn Rd Unit 3b
- 39 Berwynn Rd
- 39 Berwynn Rd Unit 4
- 39 Berwynn Rd Unit 4-B
- 39 Berwynn Rd Unit 2-B
- 39 Berwynn Rd Unit 8-B
- 39 Berwynn Rd Unit 1-B
- 39 Berwynn Rd Unit 4-A
- 39 Berwynn Rd Unit B1
- 39 Berwynn Rd Unit A8
- 39 Berwynn Rd Unit A7
- 39 Berwynn Rd Unit A6
- 39 Berwynn Rd Unit A5
- 39 Berwynn Rd Unit A4
- 39 Berwynn Rd Unit A3
- 39 Berwynn Rd Unit A2
- 39 Berwynn Rd Unit 9B