39 Bittersweet Ln Freeport, ME 04032
Estimated Value: $875,000 - $1,212,000
4
Beds
3
Baths
3,436
Sq Ft
$297/Sq Ft
Est. Value
About This Home
This home is located at 39 Bittersweet Ln, Freeport, ME 04032 and is currently estimated at $1,021,901, approximately $297 per square foot. 39 Bittersweet Ln is a home located in Cumberland County with nearby schools including Morse Street School, Mast Landing School, and Freeport Middle School.
Ownership History
Date
Name
Owned For
Owner Type
Purchase Details
Closed on
Apr 14, 2008
Sold by
Milley 2Nd Ronald A and Milley Leigh T
Bought by
Cannan Aaron and Cannan Terri
Current Estimated Value
Home Financials for this Owner
Home Financials are based on the most recent Mortgage that was taken out on this home.
Original Mortgage
$375,000
Interest Rate
6.3%
Mortgage Type
Unknown
Create a Home Valuation Report for This Property
The Home Valuation Report is an in-depth analysis detailing your home's value as well as a comparison with similar homes in the area
Home Values in the Area
Average Home Value in this Area
Purchase History
| Date | Buyer | Sale Price | Title Company |
|---|---|---|---|
| Cannan Aaron | -- | -- |
Source: Public Records
Mortgage History
| Date | Status | Borrower | Loan Amount |
|---|---|---|---|
| Open | Cannan Aaron | $377,000 | |
| Closed | Cannan Aaron | $375,000 |
Source: Public Records
Tax History
| Year | Tax Paid | Tax Assessment Tax Assessment Total Assessment is a certain percentage of the fair market value that is determined by local assessors to be the total taxable value of land and additions on the property. | Land | Improvement |
|---|---|---|---|---|
| 2025 | $9,821 | $709,100 | $161,100 | $548,000 |
| 2024 | $9,364 | $701,400 | $153,400 | $548,000 |
| 2023 | $8,458 | $615,100 | $139,500 | $475,600 |
| 2022 | $8,378 | $613,800 | $138,200 | $475,600 |
| 2021 | $8,378 | $627,600 | $152,000 | $475,600 |
| 2020 | $8,142 | $581,600 | $140,700 | $440,900 |
| 2019 | $7,831 | $547,600 | $132,800 | $414,800 |
| 2018 | $7,706 | $512,000 | $124,000 | $388,000 |
| 2017 | $7,346 | $491,400 | $121,200 | $370,200 |
| 2016 | $7,202 | $455,800 | $112,200 | $343,600 |
Source: Public Records
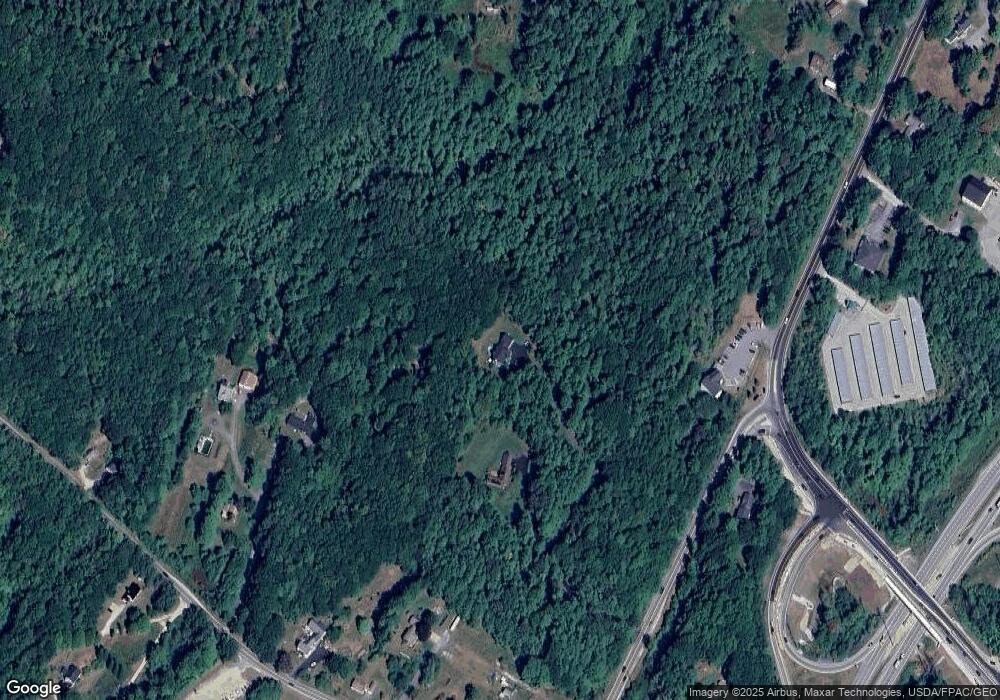
Map
Nearby Homes
- 10 Durham Rd
- 42 Durham Rd
- 212 Main St
- 5 Holbrook St
- 8 Statler Ln
- 39 Hunter Rd
- 11 Orchard Hill Rd
- 15 Linwood Rd Unit 15
- 1 Wardtown Rd
- 1260 Us Route 1
- 143 Bragdon Rd
- 4 Harper's Trail
- 26 Harvest Ridge Rd Unit 24
- 20 Harvest Ridge Rd Unit 23
- 10 Prout Rd
- 15 Tinkers Way
- 21 Renee Rd
- 0 Prout Rd
- 62 Webster Rd
- 52 Birch Point Rd
Your Personal Tour Guide
Ask me questions while you tour the home.