39 Bridge St Amherst, MA 01002
Estimated Value: $465,814 - $754,000
About This Home
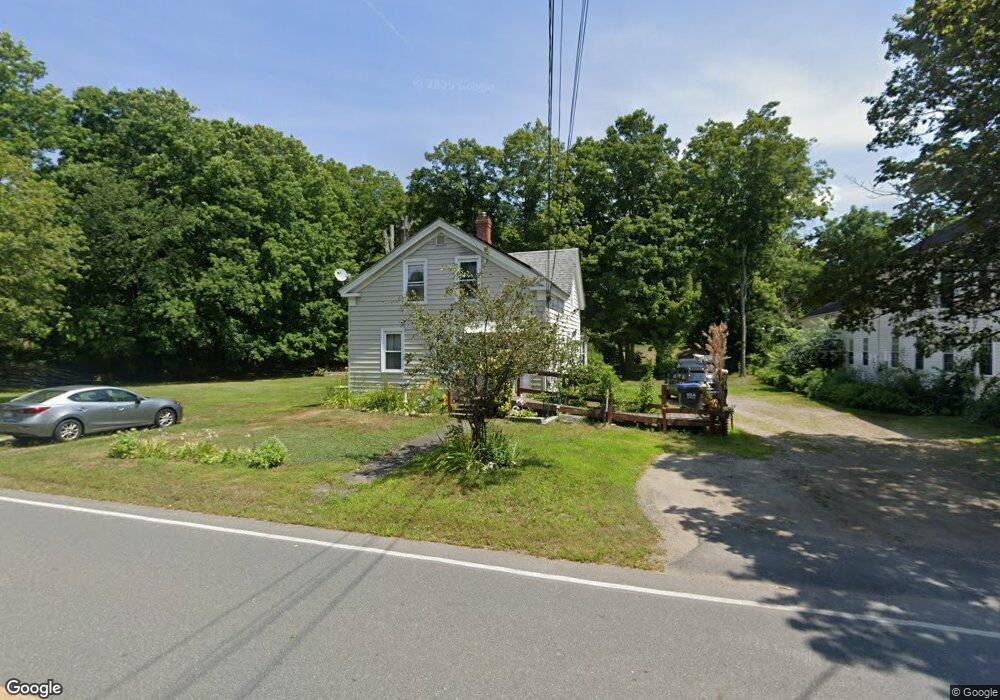
This home is located at 39 Bridge St, Amherst, MA 01002 and is currently estimated at $630,454, approximately $242 per square foot. 39 Bridge St is a home located in Hampshire County with nearby schools including Wildwood Elementary School, Amherst Regional Middle School, and Amherst Regional High School.
Ownership History
We collect this data history from publicly available records. To have your information removed, we recommend requesting removal directly through your county’s website.
Purchase Details
Home Financials for this Owner
Home Financials are based on the most recent Mortgage that was taken out on this home.Home Values in the Area
Average Home Value in this Area
Purchase History
We collect this data history from publicly available records. To have your information removed, we recommend requesting removal directly through your county’s website.
| Date | Buyer | Sale Price | Title Company |
|---|---|---|---|
| $135,000 | -- |
Mortgage History
We collect this data history from publicly available records. To have your information removed, we recommend requesting removal directly through your county’s website.
| Date | Status | Borrower | Loan Amount |
|---|---|---|---|
| Open | $30,000 | ||
| Closed | $40,000 | ||
| Closed | $35,000 | ||
| Open | $133,886 |
Tax History
We collect this data history from publicly available records. To have your information removed, we recommend requesting removal directly through your county’s website.
| Year | Tax Paid | Tax Assessment Tax Assessment Total Assessment is a certain percentage of the fair market value that is determined by local assessors to be the total taxable value of land and additions on the property. | Land | Improvement |
|---|---|---|---|---|
| 2025 | $84 | $470,100 | $160,900 | $309,200 |
| 2024 | $8,118 | $438,600 | $151,900 | $286,700 |
| 2023 | $7,797 | $387,900 | $138,300 | $249,600 |
| 2022 | $7,538 | $354,400 | $125,700 | $228,700 |
| 2021 | $7,532 | $345,200 | $116,500 | $228,700 |
| 2020 | $7,360 | $345,200 | $116,500 | $228,700 |
| 2019 | $7,070 | $324,300 | $116,500 | $207,800 |
| 2018 | $6,856 | $324,300 | $116,500 | $207,800 |
| 2017 | $6,708 | $307,300 | $111,100 | $196,200 |
| 2016 | $6,521 | $307,300 | $111,100 | $196,200 |
| 2015 | $6,312 | $307,300 | $111,100 | $196,200 |
Map
- 45 Henry St
- 20 Bridge St
- 390 State St
- 71 Morgan Cir
- Lot A Kingman Rd
- 208 Pine St Unit 53
- 471 Flat Hills Rd
- 49 Harlow Dr
- 691 E Pleasant St
- 185 Cherry Ln
- 87 Harlow Dr
- 409 Henry St
- 281 Leverett Rd
- 208 Rolling Ridge Rd
- 37 Harris St
- 1107 N Pleasant St
- 274 Sunderland Rd
- 8 Teawaddle Hill Rd
- 102 Farview Way
- 274 Strong St
Ask me questions while you tour the home.