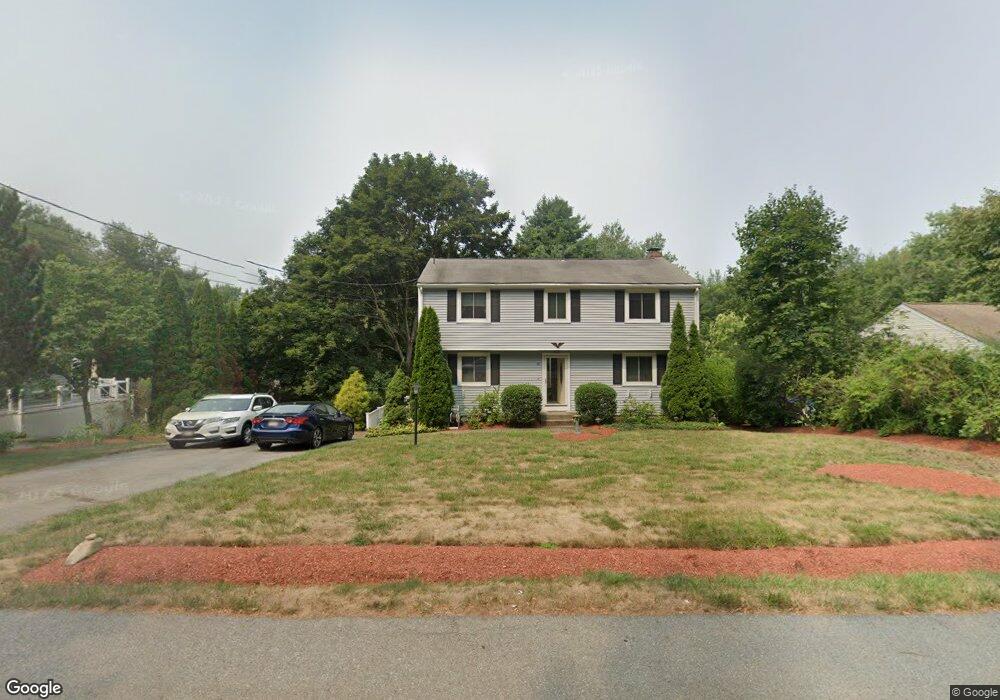
39 Brigham St Hudson, MA 01749
Estimated Value: $638,000 - $720,000
3
Beds
2
Baths
1,765
Sq Ft
$376/Sq Ft
Est. Value
About This Home
This home is located at 39 Brigham St, Hudson, MA 01749 and is currently estimated at $664,375, approximately $376 per square foot. 39 Brigham St is a home located in Middlesex County with nearby schools including David J. Quinn Middle School, Hudson High School, and First Steps Children's Center.
Ownership History
Date
Name
Owned For
Owner Type
Purchase Details
Closed on
Aug 2, 1999
Sold by
Berthiaume William A and Berthiaume Deborah J
Bought by
Bradford James R and Bradford Andrea S
Current Estimated Value
Home Financials for this Owner
Home Financials are based on the most recent Mortgage that was taken out on this home.
Original Mortgage
$170,400
Interest Rate
7.61%
Mortgage Type
Purchase Money Mortgage
Create a Home Valuation Report for This Property
The Home Valuation Report is an in-depth analysis detailing your home's value as well as a comparison with similar homes in the area
Home Values in the Area
Average Home Value in this Area
Purchase History
| Date | Buyer | Sale Price | Title Company |
|---|---|---|---|
| Bradford James R | $213,000 | -- |
Source: Public Records
Mortgage History
| Date | Status | Borrower | Loan Amount |
|---|---|---|---|
| Open | Bradford James R | $125,000 | |
| Closed | Bradford James R | $170,400 | |
| Previous Owner | Bradford James R | $20,000 | |
| Previous Owner | Bradford James R | $88,500 |
Source: Public Records
Tax History
| Year | Tax Paid | Tax Assessment Tax Assessment Total Assessment is a certain percentage of the fair market value that is determined by local assessors to be the total taxable value of land and additions on the property. | Land | Improvement |
|---|---|---|---|---|
| 2025 | $8,148 | $587,000 | $201,500 | $385,500 |
| 2024 | $7,958 | $568,400 | $182,900 | $385,500 |
| 2023 | $7,185 | $492,100 | $176,000 | $316,100 |
| 2022 | $6,839 | $431,200 | $160,100 | $271,100 |
| 2021 | $6,640 | $392,800 | $152,400 | $240,400 |
| 2020 | $6,480 | $390,100 | $149,700 | $240,400 |
| 2019 | $6,410 | $376,400 | $149,700 | $226,700 |
| 2018 | $5,652 | $366,000 | $151,600 | $214,400 |
| 2017 | $3,354 | $354,200 | $150,000 | $204,200 |
| 2016 | $5,804 | $335,700 | $150,000 | $185,700 |
| 2015 | $5,630 | $326,000 | $150,000 | $176,000 |
| 2014 | $5,357 | $307,500 | $131,400 | $176,100 |
Source: Public Records
Map
Nearby Homes
- 56 Park St
- 168 River Rd E Unit Lot 15A
- 168 River Rd E Unit Lot 5
- 168 River Rd E Unit Lot 3
- 168 River Rd E Unit Lot 11
- 168 River Rd E Unit Lot 2
- 168 River Rd E Unit Lot 6
- 122 Chapin Rd
- 110 River St
- 17 School St Unit C
- 17 School St Unit A
- 41 Walnut St
- 4 Linden St
- 18-24 River St Unit 12
- 0 Washington St
- 16 Houghton St
- 21 Felton St
- 16 Barnes Blvd Unit 16
- 11 Barracks Rd Unit 11
- 32 Barracks Rd Unit 32
Your Personal Tour Guide
Ask me questions while you tour the home.