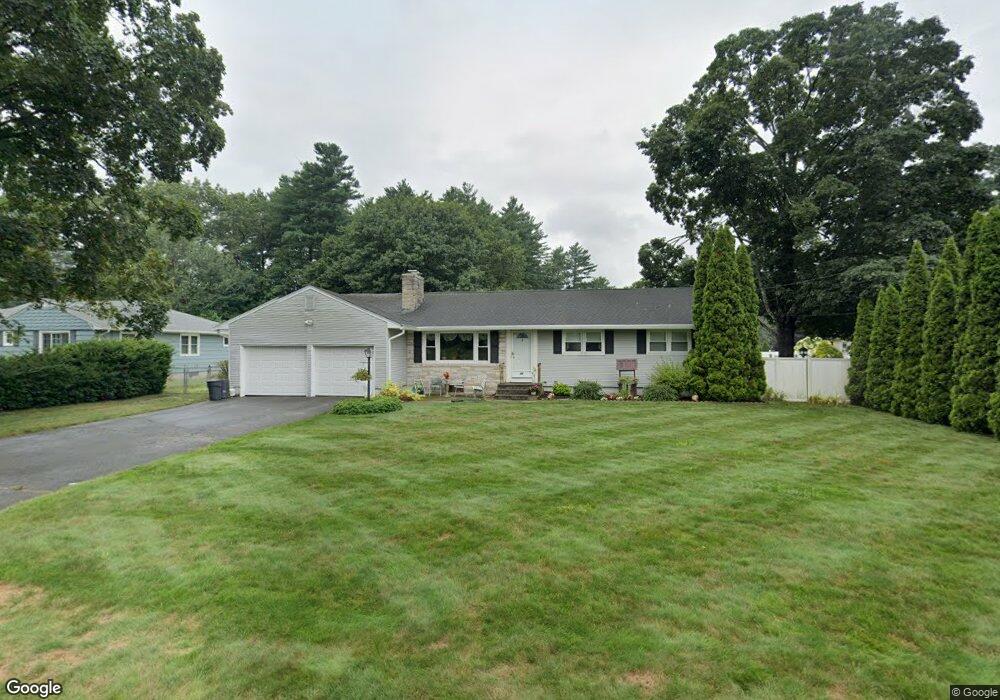
39 Brooklawn Rd Wilbraham, MA 01095
Estimated Value: $411,588 - $539,000
3
Beds
3
Baths
1,552
Sq Ft
$303/Sq Ft
Est. Value
About This Home
This home is located at 39 Brooklawn Rd, Wilbraham, MA 01095 and is currently estimated at $470,897, approximately $303 per square foot. 39 Brooklawn Rd is a home located in Hampden County with nearby schools including Minnechaug Regional High School, Springfield International Charter School, and Pioneer Valley Montessori School.
Ownership History
Date
Name
Owned For
Owner Type
Purchase Details
Closed on
May 13, 2016
Sold by
Sibilia Richard A and Sibilia Barbara M
Bought by
Sibilia Anthony M
Current Estimated Value
Home Financials for this Owner
Home Financials are based on the most recent Mortgage that was taken out on this home.
Original Mortgage
$207,200
Outstanding Balance
$163,429
Interest Rate
3.71%
Mortgage Type
New Conventional
Estimated Equity
$307,468
Purchase Details
Closed on
May 3, 1996
Sold by
Collins James A and Collins Harriet J
Bought by
Sibilia Richard A and Sibilia Barbara M
Purchase Details
Closed on
May 7, 1990
Sold by
Davis Richard H
Bought by
Collins James A
Create a Home Valuation Report for This Property
The Home Valuation Report is an in-depth analysis detailing your home's value as well as a comparison with similar homes in the area
Home Values in the Area
Average Home Value in this Area
Purchase History
| Date | Buyer | Sale Price | Title Company |
|---|---|---|---|
| Sibilia Anthony M | $259,000 | -- | |
| Sibilia Richard A | $145,000 | -- | |
| Collins James A | $150,000 | -- |
Source: Public Records
Mortgage History
| Date | Status | Borrower | Loan Amount |
|---|---|---|---|
| Open | Sibilia Anthony M | $207,200 | |
| Previous Owner | Collins James A | $15,000 | |
| Previous Owner | Collins James A | $115,000 | |
| Previous Owner | Collins James A | $17,000 |
Source: Public Records
Tax History
| Year | Tax Paid | Tax Assessment Tax Assessment Total Assessment is a certain percentage of the fair market value that is determined by local assessors to be the total taxable value of land and additions on the property. | Land | Improvement |
|---|---|---|---|---|
| 2025 | $7,193 | $402,300 | $86,700 | $315,600 |
| 2024 | $6,989 | $377,800 | $86,700 | $291,100 |
| 2023 | $6,200 | $349,200 | $86,700 | $262,500 |
| 2022 | $6,200 | $302,600 | $86,700 | $215,900 |
| 2021 | $5,784 | $251,900 | $95,300 | $156,600 |
| 2020 | $5,638 | $251,900 | $95,300 | $156,600 |
| 2019 | $5,491 | $251,900 | $95,300 | $156,600 |
| 2018 | $5,151 | $227,500 | $95,300 | $132,200 |
| 2017 | $4,686 | $213,000 | $95,300 | $117,700 |
| 2016 | $4,620 | $213,900 | $101,300 | $112,600 |
| 2015 | $4,466 | $213,900 | $101,300 | $112,600 |
Source: Public Records
Map
Nearby Homes
- 6 Brooklawn Rd
- 28 Old Lane Rd
- 70 Quentin Rd
- 11 Wellfleet Dr
- 2306 Wilbraham Rd
- 5 Edgewood Rd
- 367 Nassau Dr Unit 367
- 6V Melikian Dr
- 592 Stony Hill Rd
- 48 Castlegate Dr
- 15 Cedar Ridge Dr Unit 1
- 121 Mallowhill Rd
- 763 Stony Hill Rd
- 34 Flora St
- 25 Nassau Dr Unit 25
- 72 Nassau Dr
- 173 Nassau Dr
- 244 Nassau Dr Unit 244
- 88 Senator St
- 147 Parkerview St
Your Personal Tour Guide
Ask me questions while you tour the home.