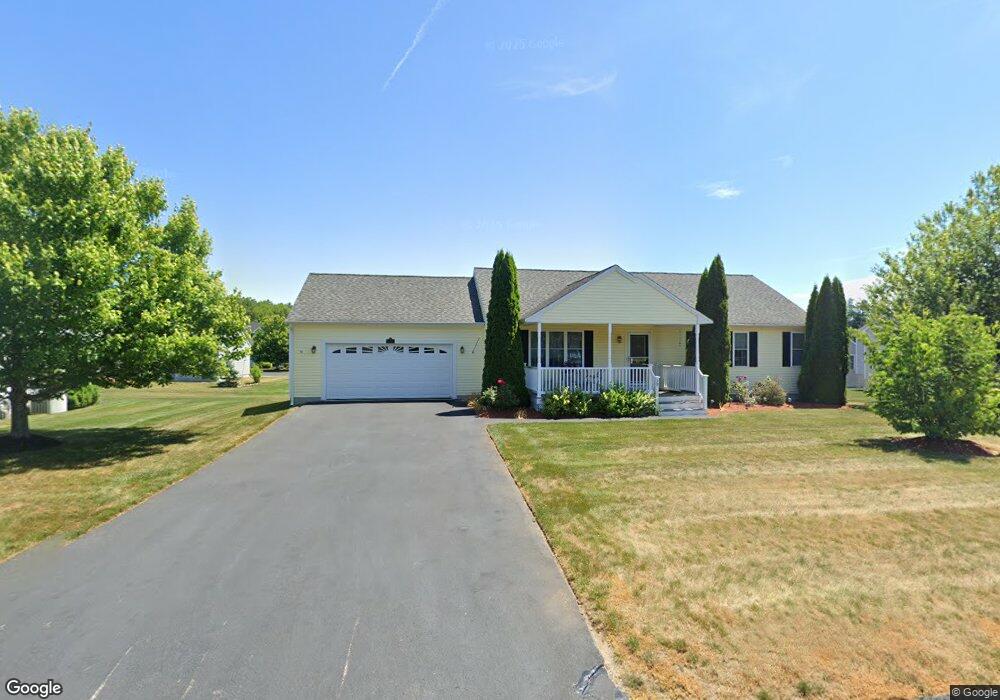
39 Carina Way East Bridgewater, MA 02333
Estimated Value: $578,699 - $632,000
2
Beds
2
Baths
1,512
Sq Ft
$395/Sq Ft
Est. Value
About This Home
This home is located at 39 Carina Way, East Bridgewater, MA 02333 and is currently estimated at $597,175, approximately $394 per square foot. 39 Carina Way is a home located in Plymouth County with nearby schools including Central Elementary School, Gordon W Mitchell Middle School, and East Bridgewater Jr./Sr. High School.
Ownership History
Date
Name
Owned For
Owner Type
Purchase Details
Closed on
Mar 24, 2009
Sold by
Dallessandro Georgianna M
Bought by
Dallessandro Georgina M and Tierney George H
Current Estimated Value
Home Financials for this Owner
Home Financials are based on the most recent Mortgage that was taken out on this home.
Original Mortgage
$65,000
Outstanding Balance
$41,593
Interest Rate
5.25%
Mortgage Type
Purchase Money Mortgage
Estimated Equity
$555,582
Purchase Details
Closed on
Feb 21, 2007
Sold by
White Pines Village In
Bought by
Tierney George H and Dallessandro Georgianna M
Home Financials for this Owner
Home Financials are based on the most recent Mortgage that was taken out on this home.
Original Mortgage
$244,000
Interest Rate
6.23%
Mortgage Type
Purchase Money Mortgage
Create a Home Valuation Report for This Property
The Home Valuation Report is an in-depth analysis detailing your home's value as well as a comparison with similar homes in the area
Home Values in the Area
Average Home Value in this Area
Purchase History
| Date | Buyer | Sale Price | Title Company |
|---|---|---|---|
| Dallessandro Georgina M | $280,000 | -- | |
| Tierney George H | $314,185 | -- |
Source: Public Records
Mortgage History
| Date | Status | Borrower | Loan Amount |
|---|---|---|---|
| Open | Tierney George H | $65,000 | |
| Previous Owner | Tierney George H | $244,000 |
Source: Public Records
Tax History Compared to Growth
Tax History
| Year | Tax Paid | Tax Assessment Tax Assessment Total Assessment is a certain percentage of the fair market value that is determined by local assessors to be the total taxable value of land and additions on the property. | Land | Improvement |
|---|---|---|---|---|
| 2025 | $6,995 | $511,700 | $124,000 | $387,700 |
| 2024 | $6,876 | $496,800 | $119,300 | $377,500 |
| 2023 | $6,692 | $463,100 | $119,300 | $343,800 |
| 2022 | $6,686 | $428,600 | $108,500 | $320,100 |
| 2021 | $6,392 | $374,900 | $104,200 | $270,700 |
| 2020 | $6,287 | $363,600 | $100,200 | $263,400 |
| 2019 | $6,028 | $343,300 | $89,400 | $253,900 |
| 2018 | $5,699 | $317,300 | $89,400 | $227,900 |
| 2017 | $5,580 | $304,900 | $85,300 | $219,600 |
| 2016 | $5,374 | $295,900 | $85,300 | $210,600 |
| 2015 | $5,211 | $293,400 | $84,700 | $208,700 |
| 2014 | $5,036 | $289,900 | $82,900 | $207,000 |
Source: Public Records
Map
Nearby Homes
- 5 Della Way
- 9 Daisy Ln
- 844 Washington St
- 1247 Central St
- 936 Central St
- 14 Mountain Ash Rd
- 1 Simmons Place
- 9 Hemlock Dr
- 572 Harvard St
- 217 Crystal Water Dr
- 182 Crystal Water Dr Unit 182
- 78 Crystal Water Dr
- 84 Washington St
- 28 Brookbend Way E
- 70 Surrey Ln
- 70 Surrey Ln
- 521 Franklin St
- 611 N Bedford St
- 585 N Bedford St
- 11 Harmony Crossing