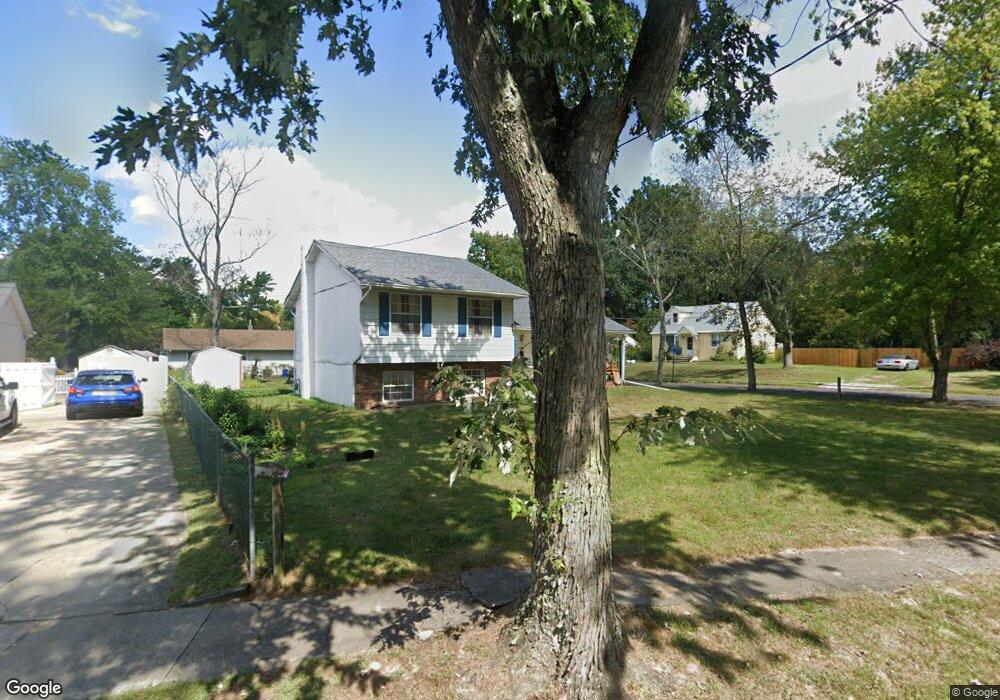
39 Cedar Ln Clementon, NJ 08021
Estimated Value: $256,294 - $312,000
--
Bed
--
Bath
1,608
Sq Ft
$177/Sq Ft
Est. Value
About This Home
This home is located at 39 Cedar Ln, Clementon, NJ 08021 and is currently estimated at $284,324, approximately $176 per square foot. 39 Cedar Ln is a home located in Camden County with nearby schools including Clementon Elementary School and South Jersey Sudbury School.
Ownership History
Date
Name
Owned For
Owner Type
Purchase Details
Closed on
Jul 29, 2005
Sold by
Chi Laurence
Bought by
Muluh Lovelyn W
Current Estimated Value
Home Financials for this Owner
Home Financials are based on the most recent Mortgage that was taken out on this home.
Original Mortgage
$135,000
Outstanding Balance
$70,370
Interest Rate
5.54%
Estimated Equity
$213,954
Purchase Details
Closed on
Nov 10, 1999
Sold by
Federal Housing Administration
Bought by
Chi Laurence A
Home Financials for this Owner
Home Financials are based on the most recent Mortgage that was taken out on this home.
Original Mortgage
$66,350
Interest Rate
7.71%
Mortgage Type
FHA
Purchase Details
Closed on
Jun 27, 1994
Sold by
Dunwoody Gerard R
Bought by
Lyons Barry J and Lyons Kimberly L
Home Financials for this Owner
Home Financials are based on the most recent Mortgage that was taken out on this home.
Original Mortgage
$105,000
Interest Rate
8.55%
Create a Home Valuation Report for This Property
The Home Valuation Report is an in-depth analysis detailing your home's value as well as a comparison with similar homes in the area
Home Values in the Area
Average Home Value in this Area
Purchase History
| Date | Buyer | Sale Price | Title Company |
|---|---|---|---|
| Muluh Lovelyn W | $150,000 | -- | |
| Chi Laurence A | $67,005 | -- | |
| Lyons Barry J | $104,900 | -- |
Source: Public Records
Mortgage History
| Date | Status | Borrower | Loan Amount |
|---|---|---|---|
| Open | Muluh Lovelyn W | $135,000 | |
| Previous Owner | Chi Laurence A | $66,350 | |
| Previous Owner | Lyons Barry J | $105,000 |
Source: Public Records
Tax History Compared to Growth
Tax History
| Year | Tax Paid | Tax Assessment Tax Assessment Total Assessment is a certain percentage of the fair market value that is determined by local assessors to be the total taxable value of land and additions on the property. | Land | Improvement |
|---|---|---|---|---|
| 2025 | $6,421 | $142,300 | $36,700 | $105,600 |
| 2024 | $6,307 | $142,300 | $36,700 | $105,600 |
| 2023 | $6,307 | $142,300 | $36,700 | $105,600 |
| 2022 | $6,201 | $142,300 | $36,700 | $105,600 |
| 2021 | $6,193 | $142,300 | $36,700 | $105,600 |
| 2020 | $6,117 | $142,300 | $36,700 | $105,600 |
| 2019 | $6,038 | $142,300 | $36,700 | $105,600 |
| 2018 | $6,113 | $142,300 | $36,700 | $105,600 |
| 2017 | $6,147 | $158,500 | $41,200 | $117,300 |
| 2016 | $5,923 | $158,500 | $41,200 | $117,300 |
| 2015 | $5,769 | $158,500 | $41,200 | $117,300 |
| 2014 | $5,725 | $158,500 | $41,200 | $117,300 |
Source: Public Records
Map
Nearby Homes
- 139 Blackwood Rd
- 200-202 Blackwood-Clementon Rd
- 3 Chews Landing Rd
- 1501-1521 Chews Landing Rd
- 38 Lincoln Ave
- 97 Erial Rd
- 42 Trowbridge Ln Unit DD
- 148 Diamond Ave
- 40 Wilson Rd
- 3 Slalom Ct
- 176 Park Ave
- 225 Chews Landing Rd
- 57 Hazel Ln
- 32 Kirk Ln
- 2701 Tall Pines
- 13 Hidden Dr
- 408 Mason Run
- 26 W 1st Ave
- 215 Erial Rd
- 407 Mason Run