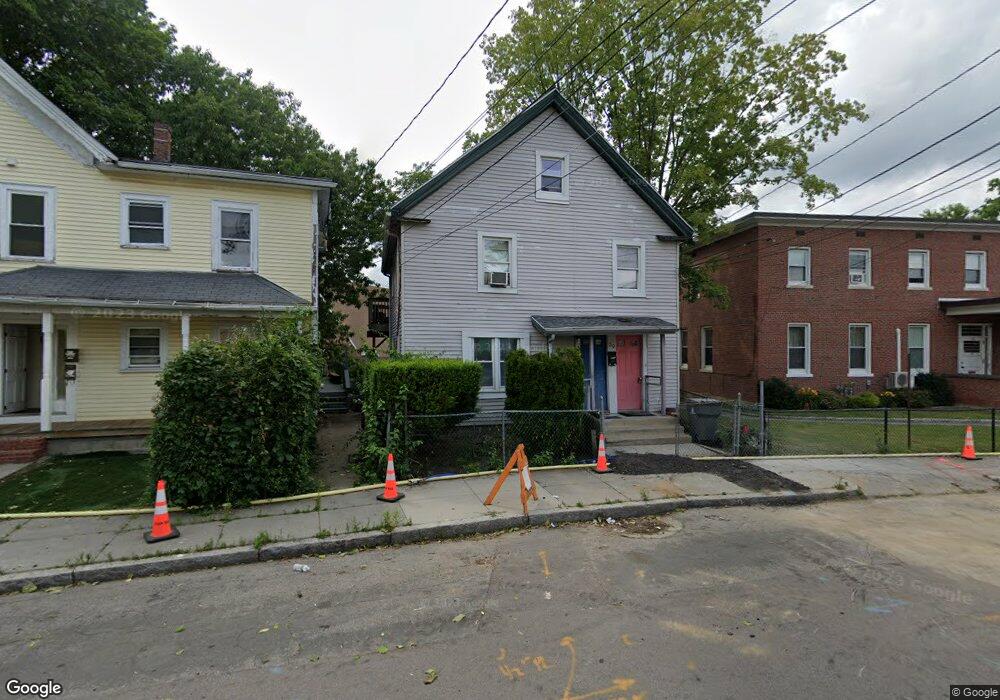
39 Cedar St Framingham, MA 01702
Estimated Value: $559,843 - $657,000
5
Beds
2
Baths
2,035
Sq Ft
$295/Sq Ft
Est. Value
About This Home
This home is located at 39 Cedar St, Framingham, MA 01702 and is currently estimated at $599,961, approximately $294 per square foot. 39 Cedar St is a home located in Middlesex County with nearby schools including Framingham High School, Happy Hollow School, and Pincushion Hill Montessori School.
Ownership History
Date
Name
Owned For
Owner Type
Purchase Details
Closed on
Sep 1, 2005
Sold by
Compaz Analicia and Guerrero Luis A
Bought by
Dassoni John P and Dassoni Vilma R
Current Estimated Value
Home Financials for this Owner
Home Financials are based on the most recent Mortgage that was taken out on this home.
Original Mortgage
$320,000
Outstanding Balance
$170,770
Interest Rate
5.81%
Mortgage Type
Purchase Money Mortgage
Estimated Equity
$429,191
Purchase Details
Closed on
Sep 14, 1998
Sold by
Rivera Sara and Reyes Antonia
Bought by
Guerrero Luis A and Compaz Analicia
Home Financials for this Owner
Home Financials are based on the most recent Mortgage that was taken out on this home.
Original Mortgage
$109,850
Interest Rate
6.92%
Mortgage Type
Purchase Money Mortgage
Create a Home Valuation Report for This Property
The Home Valuation Report is an in-depth analysis detailing your home's value as well as a comparison with similar homes in the area
Home Values in the Area
Average Home Value in this Area
Purchase History
| Date | Buyer | Sale Price | Title Company |
|---|---|---|---|
| Dassoni John P | $320,000 | -- | |
| Dassoni John P | $320,000 | -- | |
| Guerrero Luis A | $110,000 | -- | |
| Guerrero Luis A | $110,000 | -- |
Source: Public Records
Mortgage History
| Date | Status | Borrower | Loan Amount |
|---|---|---|---|
| Open | Dassoni John P | $320,000 | |
| Closed | Guerrero Luis A | $320,000 | |
| Previous Owner | Guerrero Luis A | $12,336 | |
| Previous Owner | Guerrero Luis A | $109,850 |
Source: Public Records
Tax History
| Year | Tax Paid | Tax Assessment Tax Assessment Total Assessment is a certain percentage of the fair market value that is determined by local assessors to be the total taxable value of land and additions on the property. | Land | Improvement |
|---|---|---|---|---|
| 2025 | $6,081 | $509,300 | $164,600 | $344,700 |
| 2024 | $5,889 | $472,600 | $175,500 | $297,100 |
| 2023 | $5,709 | $436,100 | $156,800 | $279,300 |
| 2022 | $5,651 | $411,300 | $142,300 | $269,000 |
| 2021 | $5,273 | $375,300 | $136,700 | $238,600 |
| 2020 | $4,940 | $329,800 | $119,100 | $210,700 |
| 2019 | $4,454 | $289,600 | $113,500 | $176,100 |
| 2018 | $4,211 | $258,000 | $105,700 | $152,300 |
| 2017 | $4,122 | $246,700 | $101,500 | $145,200 |
| 2016 | $3,886 | $223,600 | $96,000 | $127,600 |
| 2015 | $3,505 | $196,700 | $93,100 | $103,600 |
Source: Public Records
Map
Nearby Homes
- 27 Gordon St Unit 305
- 25 Eames St
- 131 Mellen St Unit 3B
- 92 Alexander St
- 69 Gilbert St
- 120 Franklin St
- 10 Rhubena St
- 768 Waverley St
- 18 Beaver Ct
- 45 Daytona Ave
- 126 Beaver St Unit 121
- 126 Beaver St Unit 5
- 12 & 14 Waverly St
- 24 Bates Rd
- 15 Bates Rd
- 150 2nd St Unit 310
- 51 Crest Rd
- 96 Mansfield St
- 7 Weld St Unit 50
- 7 Weld St Unit 29
Your Personal Tour Guide
Ask me questions while you tour the home.