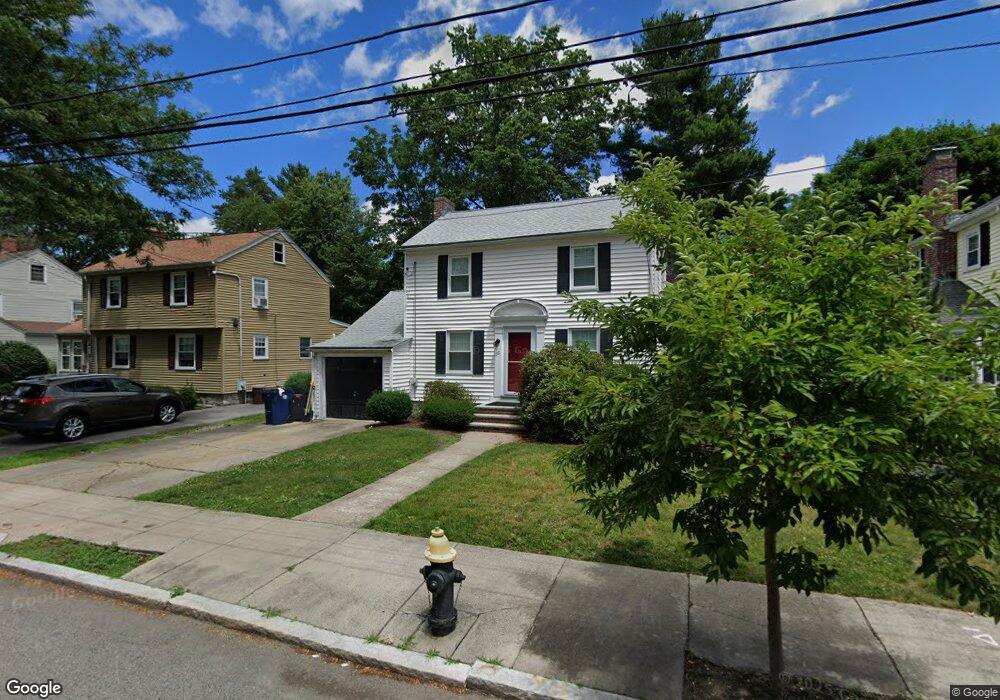
39 Chellman St West Roxbury, MA 02132
West Roxbury NeighborhoodEstimated Value: $797,182 - $952,000
3
Beds
2
Baths
1,315
Sq Ft
$655/Sq Ft
Est. Value
About This Home
This home is located at 39 Chellman St, West Roxbury, MA 02132 and is currently estimated at $860,796, approximately $654 per square foot. 39 Chellman St is a home located in Suffolk County with nearby schools including St Theresa School, Holy Name Parish School, and The Roxbury Latin School.
Ownership History
Date
Name
Owned For
Owner Type
Purchase Details
Closed on
Jul 31, 2001
Sold by
Isberg John F
Bought by
Quinn Maryanne
Current Estimated Value
Home Financials for this Owner
Home Financials are based on the most recent Mortgage that was taken out on this home.
Original Mortgage
$275,000
Interest Rate
7.18%
Mortgage Type
Purchase Money Mortgage
Purchase Details
Closed on
Nov 28, 1995
Sold by
Eder Joseph P and Kohler Sharon T
Bought by
Isberg John F and Isberg Nancy P
Home Financials for this Owner
Home Financials are based on the most recent Mortgage that was taken out on this home.
Original Mortgage
$130,000
Interest Rate
7.47%
Mortgage Type
Purchase Money Mortgage
Create a Home Valuation Report for This Property
The Home Valuation Report is an in-depth analysis detailing your home's value as well as a comparison with similar homes in the area
Home Values in the Area
Average Home Value in this Area
Purchase History
| Date | Buyer | Sale Price | Title Company |
|---|---|---|---|
| Quinn Maryanne | $359,000 | -- | |
| Isberg John F | $170,000 | -- |
Source: Public Records
Mortgage History
| Date | Status | Borrower | Loan Amount |
|---|---|---|---|
| Open | Quinn Maryanne | $286,700 | |
| Closed | Quinn Maryanne | $10,000 | |
| Closed | Quinn Maryanne | $275,000 | |
| Previous Owner | Isberg John F | $130,000 |
Source: Public Records
Tax History Compared to Growth
Tax History
| Year | Tax Paid | Tax Assessment Tax Assessment Total Assessment is a certain percentage of the fair market value that is determined by local assessors to be the total taxable value of land and additions on the property. | Land | Improvement |
|---|---|---|---|---|
| 2025 | $7,358 | $635,400 | $231,600 | $403,800 |
| 2024 | $6,601 | $605,600 | $233,800 | $371,800 |
| 2023 | $6,313 | $587,800 | $227,000 | $360,800 |
| 2022 | $5,813 | $534,300 | $206,300 | $328,000 |
| 2021 | $5,314 | $498,000 | $196,500 | $301,500 |
| 2020 | $4,968 | $470,500 | $182,600 | $287,900 |
| 2019 | $4,769 | $452,500 | $150,600 | $301,900 |
| 2018 | $4,391 | $419,000 | $150,600 | $268,400 |
| 2017 | $4,348 | $410,600 | $150,600 | $260,000 |
| 2016 | $4,182 | $380,200 | $150,600 | $229,600 |
| 2015 | $4,650 | $384,000 | $171,200 | $212,800 |
| 2014 | $4,558 | $362,300 | $171,200 | $191,100 |
Source: Public Records
Map
Nearby Homes
- 89 Dwinell St
- 76 Vermont St
- 9 Carroll St
- 845 Lagrange St Unit 4
- 701 Vfw Pkwy
- 865 Lagrange St Unit 5
- 577 Baker St Unit 577
- 331 Vermont St
- 168 Maple St
- 139 Newfield St
- 579 Baker St Unit 579
- 539 Lagrange St
- 76 Potomac St
- 931 Lagrange St
- 183 Temple St
- 105 Chesbrough Rd
- 37 Hastings St Unit 103
- 73 Dent St Unit 1
- 59 Chesbrough Rd
- 1206 Lagrange St